
Figures & data
Table 1. Baseline and follow up data of enrolled patients.
Figure 1. Alpha diversity of the skin microbiota. The Shannon_e (A), Chao1 (B), Jost (C), equitability (D), and richness (E) indexes were compared between the peri-catheter and the contralateral control sites. Paired Wilcoxon tests were conducted, and the p values are labeled in each plot.
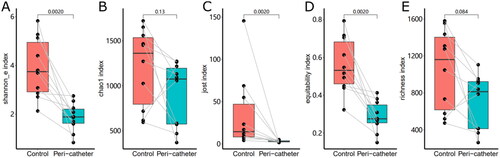
Figure 2. The beta diversity of skin microbiota. NMDS analysis was performed based on Bray distance. The 2-D coordinates were plotted with polygons indicating the groups (A) or with lines connecting paired samples from the same patients (B).
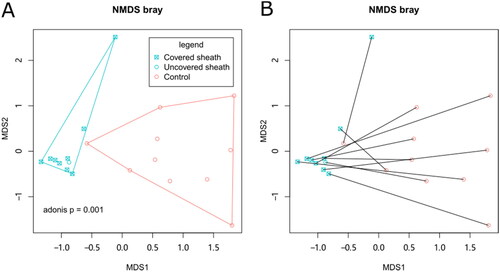
Figure 3. The abundance of the major phyla in the skin microbiota. The phyla Firmicutes (A), Actinobacteria (B), Proteobacteria (C), Acidobacteria (D), and Bacteroidetes (E) were compared between the peri-catheter and the contralateral control sites. Paired Wilcoxon tests were conducted, and the p values are labeled in each plot.
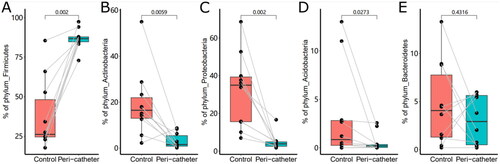
Figure 4. The LEfSe Analysis of the skin microbiota. Biomarkers with LDA score absolute values greater than 3 were plotted as bars (a). The abundance of Staphylococcus (B), Zotu1 (C), Cutibacterium (D), and Streptococcus (E) were compared between the peri-catheter and the contralateral control sites. Paired Wilcoxon tests were conducted, and the p values are labeled in each plot (B ∼ E).
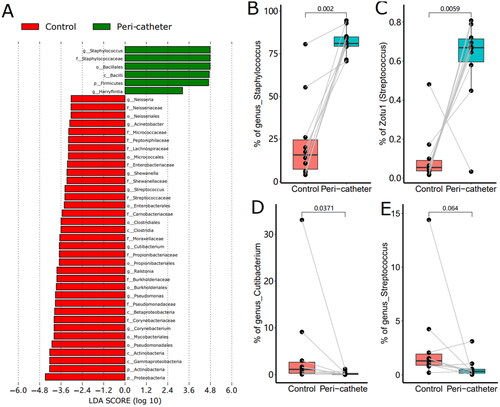
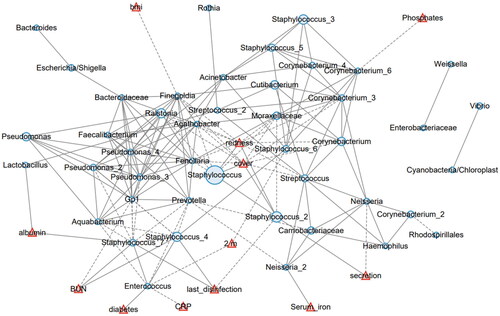
Figure 5. The network analysis involving the skin microbiota and environmental factors. The 50 most abundant ZOTUs are represented in light blue circles, with their diameters proportional to the square roots of the mean abundance in all involved samples. The environmental factors are plotted in red triangles. Solid lines represent positive correlations, and dashed lines represent negative correlations.
Data availability statement
The sequencing data generated for this study can be found in the National Center for Biotechnology Information (NCBI) database, with the accession code PRJNA1061650. The sequence data is publicly available.