
Figures & data
Figure 1. Literature screening process.
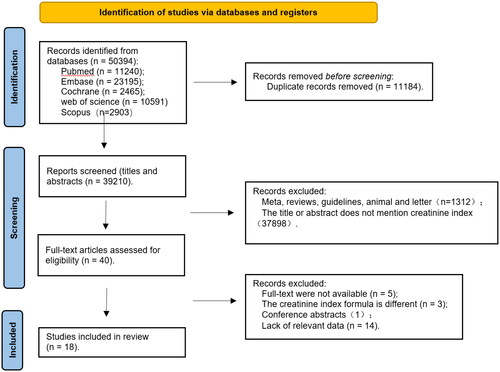
Table 1. General characteristics of included studies.!!
Figure 2. Forest plot for the association between low and high levels of mCI and the duration of maintenance of dialysis in HD patients.
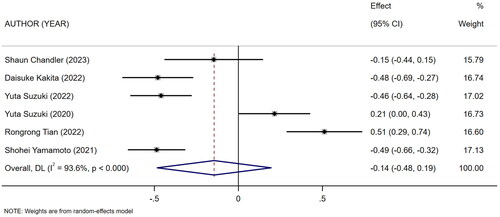
Figure 3. Forest plot for the association between mCI and BMI.
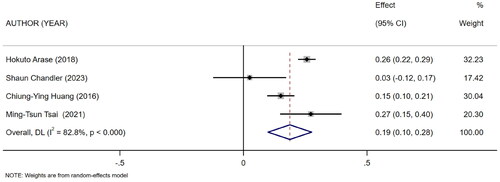
Figure 4. Forest plot for the association between mCI and albumin.
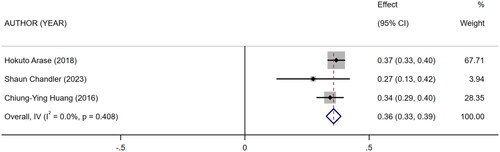
Figure 5. Forest plot for the association between mCI and nPCR.
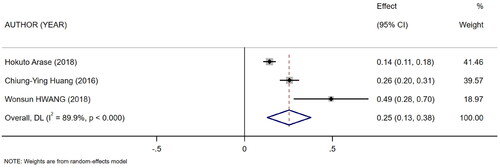
Figure 6. Forest plot for the association between mCI and survival/death in HD patients.
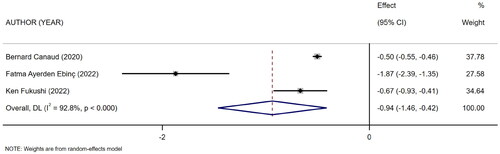
Figure 7. Forest plot for the association between mCI and risk of all-cause death in HD patients.
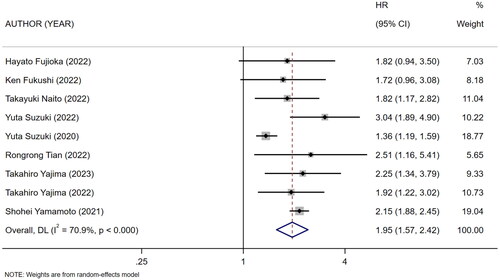
Figure 8. Forest plot for the association between mCI (21 mg/kg day) and risk of all-cause death in HD patients.
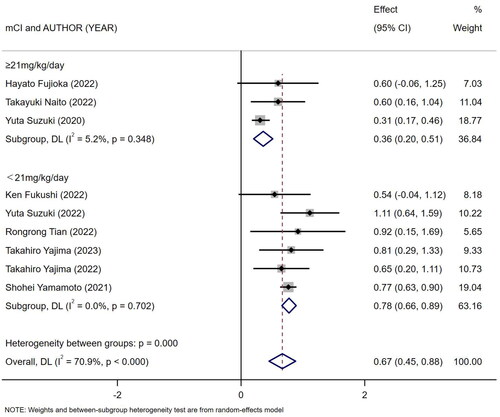
Figure 9. Test for publication bias in the association between mCI and risk of all-cause death in HD patients.
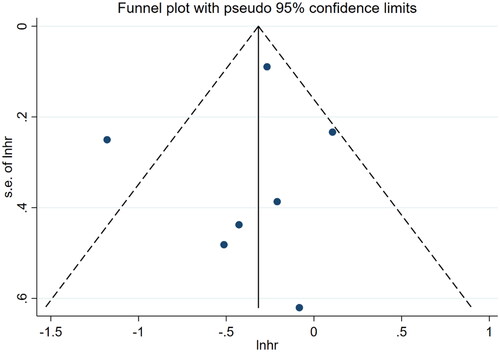
Figure 10. Forest plot for the association between mCI and OS in HD patients.
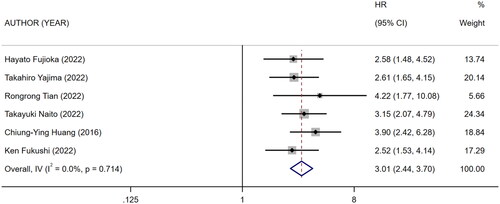
Figure 11. Sensitivity and specificity of mCI in predicting sarcopenia in male HD patients.
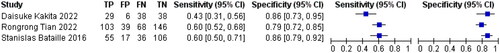
Figure 12. Sensitivity and specificity of mCI in predicting sarcopenia in female HD patients.
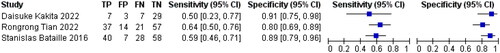
Figure 13. SROC curve for mCI in predicting sarcopenia in male HD patients.
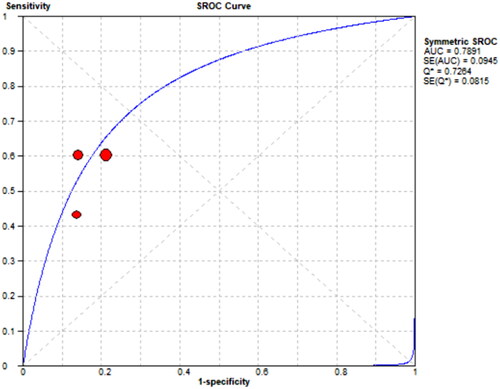
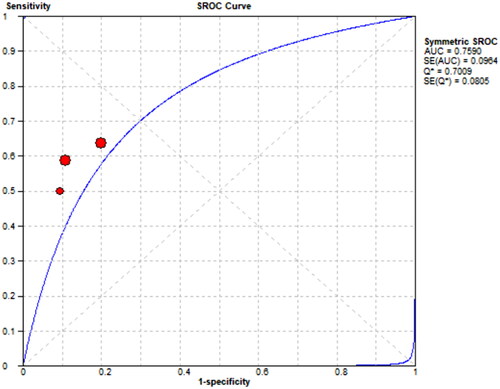
Figure 14. SROC curve for mCI in predicting sarcopenia in female HD patients.
Supplemental Material
Download MS Word (441 KB)Data availability statement
All data generated or analyzed during this study are included in this published article.