
Figures & data
Figure 1. Flow chart of the participants.
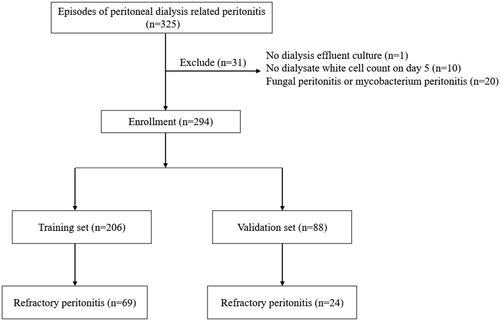
Table 1. Characteristics of the training and validation sets.
Table 2. Characteristics of refractory and non-refractory peritonitis in the training set.
Figure 2. LASSO regression analysis for refractory peritonitis. Selection of tuning parameter (λ) using 10-fold cross-validation (A) and LASSO coefficient profiles of variables (B).
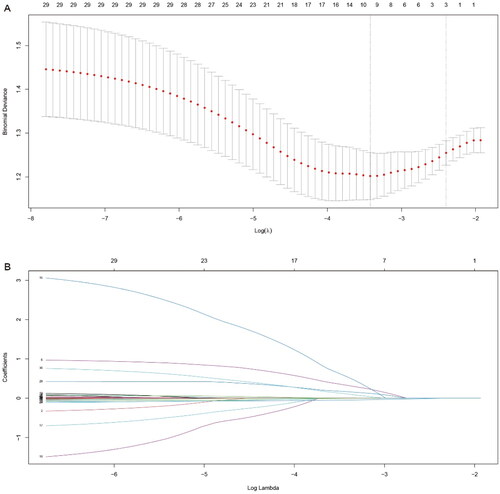
Figure 3. Random Forest algorithm to identify potential biomarkers for refractory peritonitis. CRP: C-reactive protein; iPTH: intact parathyroid hormone; PD: peritoneal dialysis; CO2CP: carbon dioxide combining power.
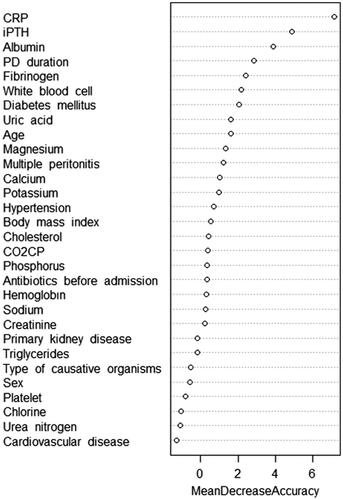
Table 3. Univariate logistic regression analysis for refractory peritonitis in the training set.
Table 4. Multivariate logistic regression analysis for refractory peritonitis in the training set.
Figure 4. Nomogram for predicting refractory peritonitis. CRP: C-reactive protein; PD: peritoneal dialysis; *means p < 0.05; **means p < 0.01; ***means p < 0.001.
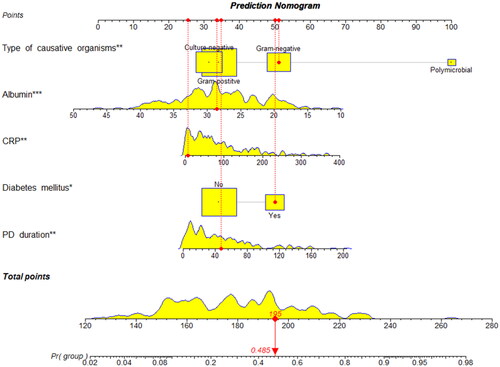
Figure 5. The ROC curves of nomogram for predicting refractory peritonitis in the training set (A) and validation set (B).
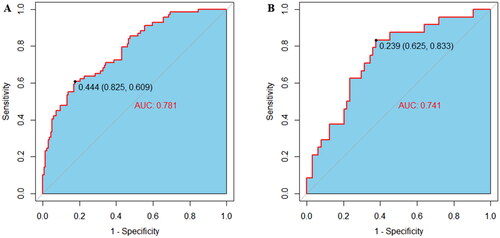
Figure 6. The calibrate curves of nomogram for predicting refractory peritonitis in the training set (A) and validation set (B).
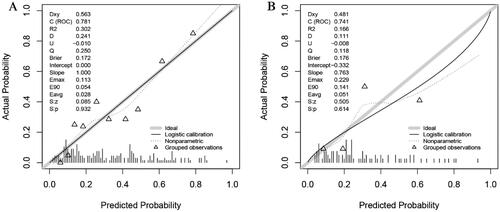
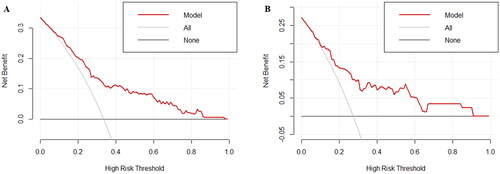
Figure 7. The decision curves of nomogram for predicting refractory peritonitis in the training set (A) and validation set (B).
Supplemental Material
Download MS Word (20.6 KB)Data availability statement
Data will be made available on request.