
Figures & data
Figure 1. Comparison of catheter function at different negative pressures in vitro test.
COFV: catheter outflow velocity ****p < 0.0001; ns: p > 0.05.
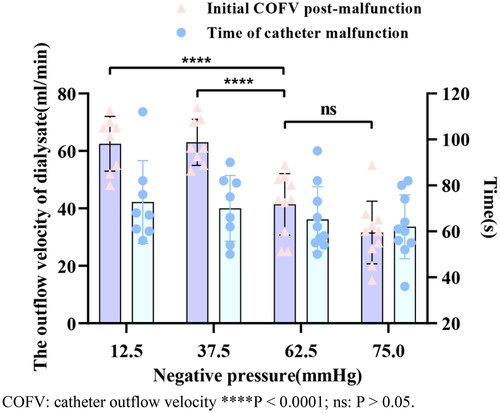
Table 1. Comparison of catheter function after catheter implantation and omental-wrapped in Beagles.
Figure 2. Performance of the omental wrapped model in beagles.
a. Complete encapsulation of the peritoneal dialysis catheter by the omentum. b. Green arrow: Omental wrapped the side holes of catheter and entered the lumen. c. Orange box: Omental wrapped the tip of the catheter.
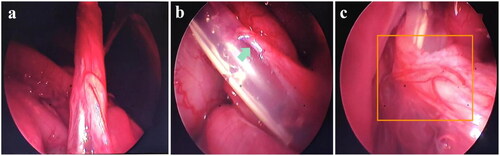
Table 2. Assessment of catheter malfunction in beagle models.
Table 3. Catheter functionality and complications assessment 7 days post-modelling.
Supplemental Material
Download MS Word (1.5 MB)Data availability statement
The datasets used and analyzed during the current study available from the corresponding author on reasonable request.