
Figures & data
Figure 1. The PRISMA flow diagram for search and selection processes of the meta-analysis.
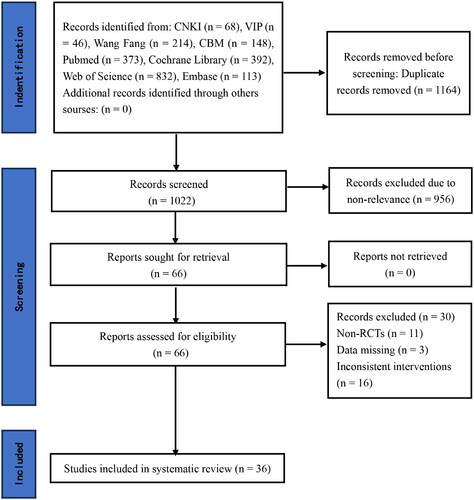
Table 1. Basic characteristics of included randomized controlled trials.
Table 2. The specific details of the interventions.
Figure 2. Results of risk of bias graphs.
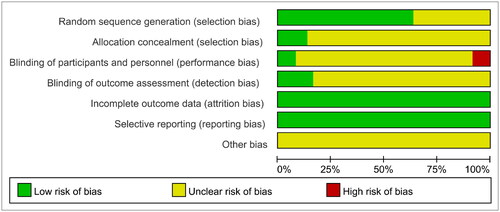
Figure 3. Network diagrams of comparisons on different outcomes of treatments in different groups of non dialysis chronic kidney disease patients. A: eGFR; B: Scr; C: 24hUTP; D: BMI; E: SBP; F: DBP; G: TC; H: TG; I: HbA1c; J: 6MWT; K: VO2 peak; AT: aerobic exercise therapy; RT: resistance exercise therapy; CBT: combined (Resistance-Aerobic) exercise therapy; CT: conventional therapy.
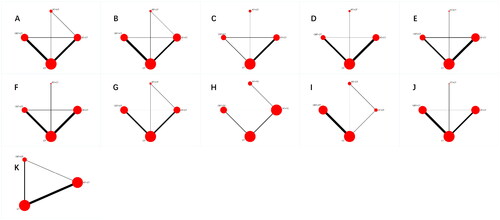
Figure 4. Pooled estimates of the network meta-analysis. A: eGFR; B: Scr; C: 24hUTP; D: BMI; E: SBP; F: DBP; G: TC; H: TG; I: HbA1c; J: 6MWT; K: VO2 peak; AT: aerobic exercise therapy; RT: resistance exercise therapy; CBT: combined (Resistance-Aerobic) exercise therapy; CT: conventional therapy.
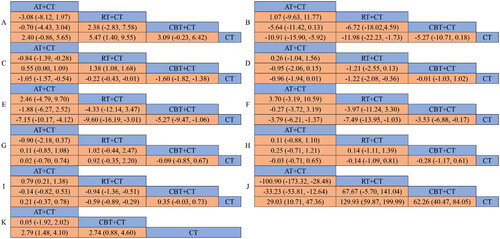
Figure 5. Surface under the cumulative ranking area for outcomes. A: eGFR; B: Scr; C: 24hUTP; D: BMI; E: SBP; F: DBP; G: TC; H: TG; I: HbA1c; J: 6MWT; K: VO2 peak; AT: aerobic exercise therapy; RT: resistance exercise therapy; CBT: combined (Resistance-Aerobic) exercise therapy; CT: conventional therapy.
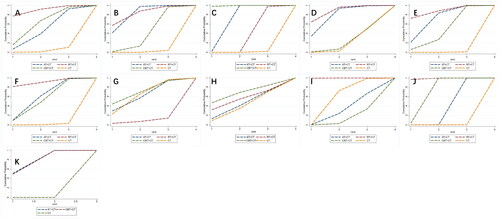
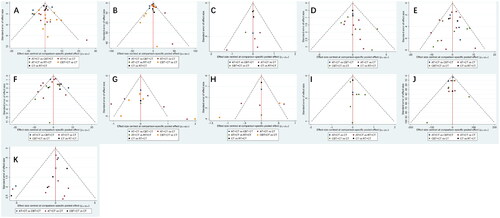
Figure 6. Risk of bias funnel chart. A: eGFR; B: Scr; C: 24hUTP; D: BMI; E: SBP; F: DBP; G: TC; H: TG; I: HbA1c; J: 6MWT; K: VO2 peak; AT: aerobic exercise therapy; RT: resistance exercise therapy; CBT: combined (Resistance-Aerobic) exercise therapy; CT: conventional therapy.
Supplemental Material
Download MS Word (20.6 KB)Data availability statement
The original data involved in this study can be requested by contacting the corresponding author (MZ) or the first author.