
Figures & data
Figure 1. Renal impairment in HBV-Tg mice. Proteinuria, serum albumin and creatinine levels in WT and HBV-Tg mice at 24 weeks were measured. Data are presented as the mean ± SD. *p < 0.05.
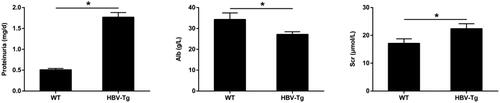
Figure 2. HBx upregulation and immune cells infiltration in HBV-Tg mice. Scale bar: 50 μm. Immunohistochemistry for HBx, CD4, and CD68 in the renal tissue from WT and HBV-Tg mice. Data are presented as the mean ± SD. *p < 0.05.
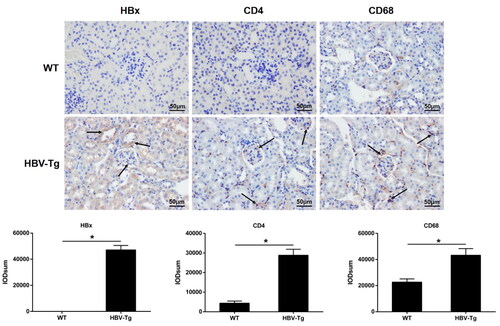
Figure 3. Upregulated MHC-II and CD40 expression in the podocytes of HBV-Tg mice, and infiltrated CD4+ T cells exhibited increased CD40L expression in the glomeruli. Scale bar: 15 μm. (A-C) Immunofluorescence for MHC-II (a), CD40 (B), CD4 and CD40L (C) in WT and HBV-Tg mice. Analysis of mean optical density in each group. Data are presented as the mean ± SD. *p < 0.05.
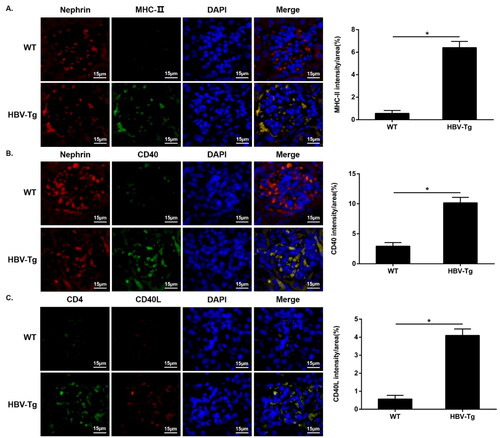
Figure 4. Significantly upregulated the CD40 expression in HBx-podocytes. Flow cytometry analysis of CD40 expression in human podocytes with empty vector lentivirus (NC) or HBx-expressing lentivirus (HBx-podocytes) transfection and without transfection (cont) for 24 h. Data are presented as the mean ± SD (n = 3). *p < 0.05.
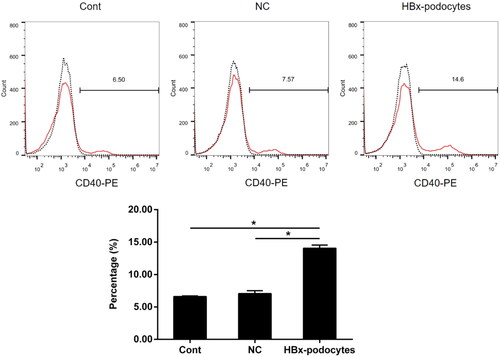
Figure 5. HBx-podocytes modulate the CD40L expression in CD4+ T cells. Flow cytometry analysis of CD40L expression in CD4+ T cells co-cultured with human podocytes with or without HBx transfection for 24 h. Data are presented as the mean ± SD (n = 3). *p < 0.05.
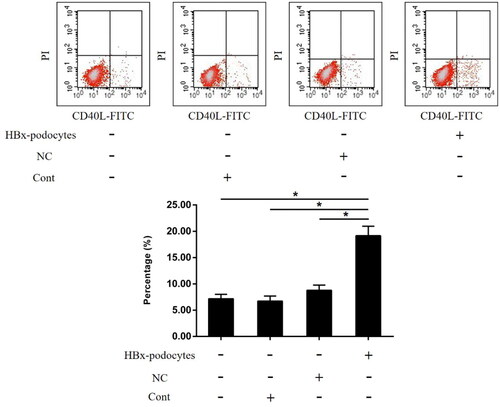
Figure 6. HBx-podocytes alter the cytokines production of activated CD4+ T cells. ELISA analysis of IFN-γ and IL-4 levels in the supernatants of co-culture systems. Data are presented as the mean ± SD (n = 3). *p < 0.05.
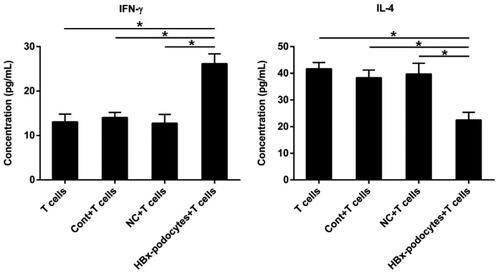
Figure 7. Enhanced macrophage adherence after HBx-podocytes supernatants treatment. Macrophages adhesion ability after co-culture with supernatants of cont, NC, and HBx-podocytes groups for 6 h was analyzed. (A) Microscopic counting method; (B) CCK-8 assay. Data are presented as the mean ± SD (n = 3). *p < 0.05.
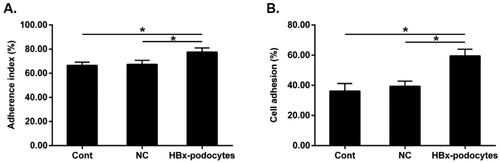
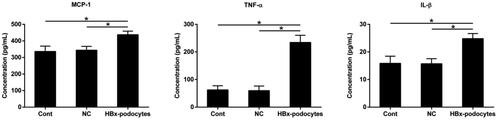
Figure 8. HBx-podocytes stimulate the inflammatory cytokines secretion of macrophages. ELISA analysis of MCP-1, TNF-α, and IL-1β levels after co-culture with supernatants of cont, NC, and HBx-podocytes groups for 12 h. Data are presented as the mean ± SD (n = 3). *p < 0.05.
Data availability statement
The datasets used and/or analyzed during the current study are available from the corresponding author on reasonable request.