
Figures & data
Table 1. Comparison of clinical and coagulation features in patients with IMN and patients with MCD.
Figure 1. Biopsy finding of patients with IMN who were glomerular PLA2R staining-positive (GAg+). immunofluorescence includes staining for PLA2R, IgG and C3.
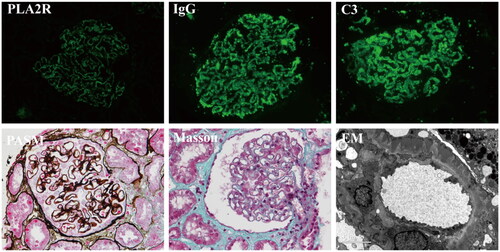
Table 2. Comparison of clinical and coagulation features in patients with IMN who were GAg + and patients with IMN who were GAg.
Table 3. Comparison of clinical and coagulation features in patients with IMN who were SAb+/GAg + and patients with IMN who were SAb-/GAg+.
Figure 2. The scatter plots indicate the correlation between anti-PLA2R antibodies and the coagulation indices in patients with IMN who were SAb+/GAg+. anti-PLA2R antibody was highly skewed, so natural log transformation was used for the analysis.
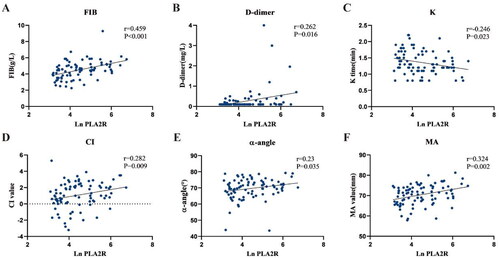
Table 4. Multiple linear regression analysis of fibrinogen and clinical indicators in patients with IMN who were SAb+/GAg+.
Table 5. Multiple Linear regression analysis of the MA value and clinical indicators in patients with IMN who were SAb+/GAg+.
Data availability statement
The data underlying this article will be shared upon reasonable request to the corresponding author.