
Figures & data
Table 1. Demographic table for all cardiac surgery patients.
Figure 1. The mean Raman spectra of urine of acute kidney injury (AKI), and non-AKI group.
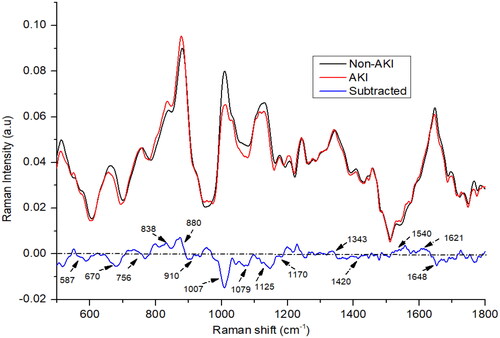
Figure 2. The mean Raman spectra of urine of acute kidney injury (AKI) stage 1, and non-AKI group.
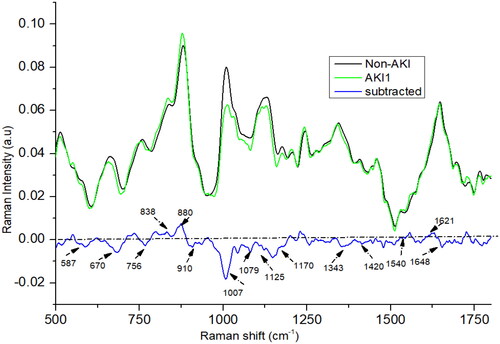
Figure 3. The mean Raman spectra of urine of acute kidney injury (AKI) stage 2, and non-AKI group.
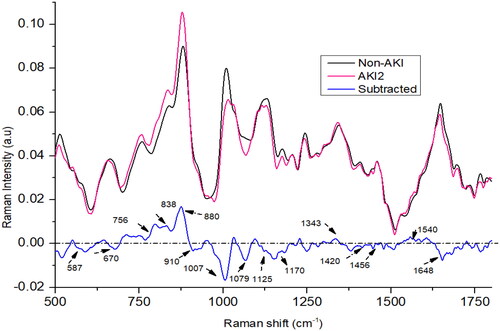
Figure 4. The mean Raman spectra of urine of acute kidney injury (AKI) stage 3, and non-AKI group.
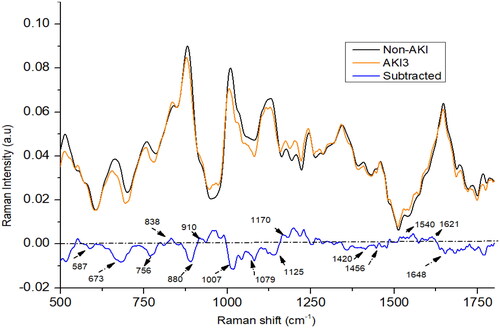
Figure 5. Screen plot of the cumulative percentages of the first 15 PLS components (a) with the percentage variance of x (predictors) and y (response variables) (b) with the accuracy curve of PLS-SVM algorithm, the inset shows the PLS-scatter plot.
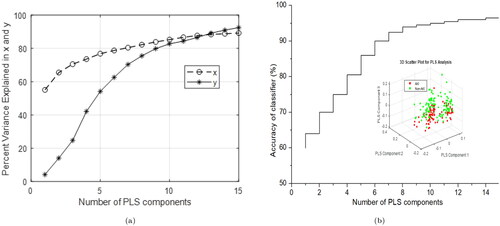
Table 2. Classification parameters of AKI and non-AKI group using PLS-SVM classifier: SEN (sensitivity), SPE (specificity), AC (accuracy), F1 (F1-score), BAC (balanced accuracy), and MCC (Matthew’s correlation coefficient).
Table 3. Stage bias classification parameters of AKI and non-AKI group using PLS-SVM classifier: SEN (sensitivity), SPE (specificity), AC (accuracy), precision (PRE), F1 (F1-score), BAC (balanced accuracy), and MCC (Matthew’s correlation coefficient).
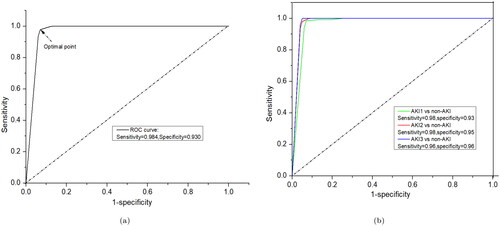
Figure 6. ROC curves for classification results using PLS-SVM: (a) AKI vs. non-AKI factors and (b) non-AKI vs. individual AKI stages.
The_clean_editable_revised_paper.7z
Download (781 KB)Data availability statement
Data are available from the corresponding author upon reasonable request.