
Figures & data
Figure 1. The flow chart of the study.
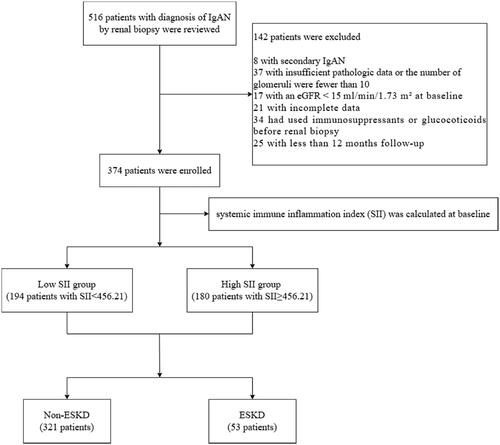
Table 1. Comparison of baseline demographic, clinical, and pathological data between patients in the non-ESKD and ESKD groups.
Figure 2. ROC curve of the SII for predicting ESKD in IgAN patients.
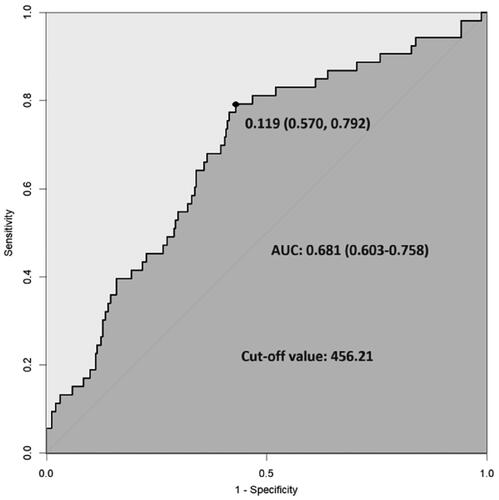
Figure 3. Comparison of ESKD rates according to the SII.
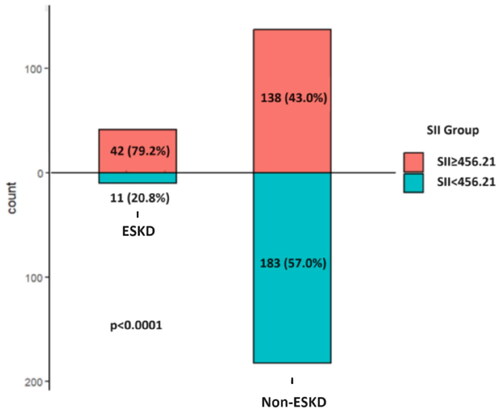
Table 2. Comparison of baseline demographic, clinical, and pathological data between patients in the low-SII and high-SII groups.
Figure 4. Kaplan–Meier survival curves of the SII in different subgroups according to sex, baseline eGFR, baseline 24-h UTP, use of immunosuppressants or glucocorticoids, and use of ACEIs/ARBs.
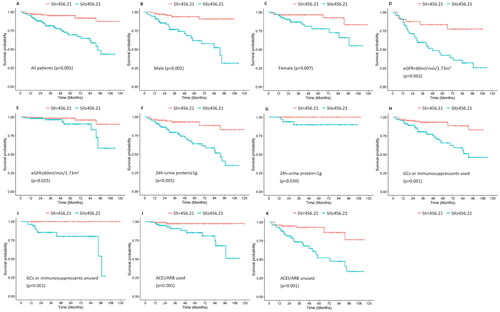
Table 3. Univariate and multivariate Cox regression analyses of renal survival in patients with IgAN.
Data availability statement
The raw data used in the current study are available from the corresponding author upon reasonable request for noncommercial use.