
Figures & data
Figure 1. Design framework of the MR analysis between Lp(a) and CKD. This analysis is consistent with the hypothesis that genetic variants (SNPs) are significantly associated with Lp(a) but not with confounding factors and that SNPs are not directly related to CKD risk. MR, Mendelian randomization; SNP, single-nucleotide polymorphism; Lp(a), lipoprotein (a); CKD, chronic kidney disease.
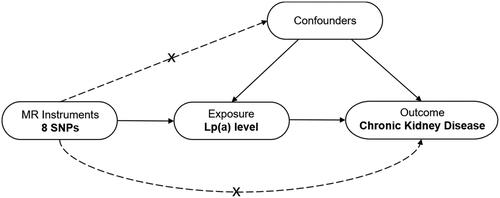
Table 1. Overview of the datasets used for analyses.
Table 2. Characteristics of included eight SNPs associated with Lp(a) level.
Figure 2. Causal role of genetically predicted Lp(a) level on CKD. (A) Causal estimate of each individual SNP to CKD in fixed-effect IVW analysis. The Y-axis indicates each individual SNP, the X-axis indicates the genetic association with CKD of each SNP. The black dots and lines represent the causal estimates with 95% CI of individual SNP. The red dots and lines represent the overall effect of summarized SNPs using MR egger [estimated β = 0.028, 95% CI (−0.028, 0.085), p = 0.325] and IVW method [estimated β = 0.038, 95% CI (0.009, 0.067), p = 0.010]. (B) Scatter plot of the association of each SNP with Lp(a) and CKD. The points represented the causal estimates of each individual SNP with Lpa (X-axis) and CKD (Y-axis). The line indicated the estimate of effect of Lp(a) and CKD using fixed-IVW method. CKD, chronic kidney disease; CI, confidence interval; IVW, inverse variance weighted; Lp(a), lipoprotein(a); MR, Mendelian randomization; SE, standard error; SNP, single nucleotide polymorphism.
![Figure 2. Causal role of genetically predicted Lp(a) level on CKD. (A) Causal estimate of each individual SNP to CKD in fixed-effect IVW analysis. The Y-axis indicates each individual SNP, the X-axis indicates the genetic association with CKD of each SNP. The black dots and lines represent the causal estimates with 95% CI of individual SNP. The red dots and lines represent the overall effect of summarized SNPs using MR egger [estimated β = 0.028, 95% CI (−0.028, 0.085), p = 0.325] and IVW method [estimated β = 0.038, 95% CI (0.009, 0.067), p = 0.010]. (B) Scatter plot of the association of each SNP with Lp(a) and CKD. The points represented the causal estimates of each individual SNP with Lpa (X-axis) and CKD (Y-axis). The line indicated the estimate of effect of Lp(a) and CKD using fixed-IVW method. CKD, chronic kidney disease; CI, confidence interval; IVW, inverse variance weighted; Lp(a), lipoprotein(a); MR, Mendelian randomization; SE, standard error; SNP, single nucleotide polymorphism.](/cms/asset/7803d276-31a1-4a11-8553-8e4449cd24a9/irnf_a_2383727_f0002_c.jpg)
Table 3. Association of Lp(a) levels with CKD risk using various methods.
Table 4. MR-Egger intercept test results of association between Lp(a) and CKD.
Table 5. Heterogeneity test results of association between Lp(a) and CKD.
Table 6. Association of CKD with Lp(a) using various methods.
Supplementary material_revised.docx
Download MS Word (442.9 KB)Data availability statement
The datasets used and/or analyzed during the current study are available from the corresponding author on reasonable request. All data generated or analyzed during this study are included in this article. Further enquiries can be directed to the corresponding author.