
Figures & data
Figure 1. Flowchart of case ascertainment.
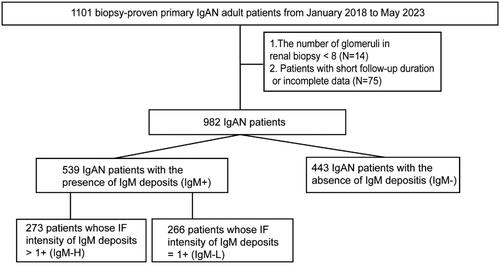
Table 1. baseline characteristics of patients according to the degree of IgM deposits in renal biopsy after matching.
Figure 2. (A) Disparities in clinical data between the IgM-L and IgM-H in different subgroups. The subgroups were constructed according to the pathologic manifestation in the Oxford classification. The medians, interquartile ranges, and distributions of clinical data in each subgroup were calculated to perform the violin, scatter, and box plots. The p value <0.05 was marked as ‘*’ and p < 0.01 as ‘**’ in the plot. (B) The network diagram illustrates the clustering relationship of clinical factors within IgM-L and IgM-H. All linear data were converted to hierarchical data according to the quantile. Each factor is represented by a node, with circle nodes representing IgM-H and square nodes representing IgM-L. Nodes that are linked by solid black lines indicate a stronger correlation and form a cluster, while nodes that are linked by solid gray lines represent the same factors from various groups (assigned a small weight for the same factors and a larger weight for different factors).
IgM-H refers to IgAN patients whose IF intensity of IgM deposits exceeded 1+, while IgM-L represents IgAN patients whose IF intensity of IgM deposits was equal to 1+. Alb: serum albumin; BMI: body mass index; Hb: hemoglobin; HDL: HDL-cholesterol; LDL: LDL-cholesterol; SBP: systolic blood pressure; DBP: diastolic blood pressure; S-Cr: serum creatinine; TC: total cholesterol; TG: triglyceride; UA: serum uric acid; S-IgA: serum IgA; S-IgG: serum IgG; S-IgM: serum IgM; S-C3: serum C3; S-C4: serum C4; UACR: urine albumin/creatinine ratio; TA UACR: time averaged urine albumin/creatinine ratio; SII: systemic immune-inflammation index; TA SII: time averaged systemic immune-inflammation index; 24h-UP: 24-hour urine protein.
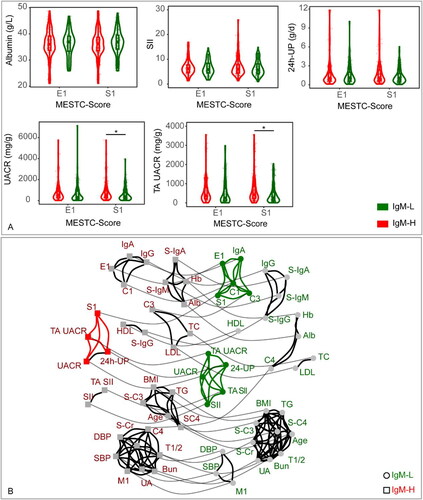
Figure 3. (A) Kaplan-Meier Curve displayed the prognosis of the IgM + and IgM– cohorts (p = 0.27 [log-rank test]). The endpoint was defined as either a reduction of ≥50% in baseline eGFR or the development of ESRD. (B) Estimated marginal means and corresponding SEs of serum creatinine levels were estimated and compared between IgM + and IgM– cohorts within the follow-up period using GLMM. (C) Estimated marginal means and corresponding SEs of urine albumin/creatinine ratio levels were estimated and compared between IgM + and IgM– cohorts within the follow-up period using GLMM. (D) Estimated marginal means and corresponding SEs of serum albumin levels were estimated and compared between IgM + and IgM– cohorts within the follow-up period using GLMM.
Statistical significance levels are indicated in the plot as ‘*’, which represents p < 0.05, and ‘**’, representing p < 0.01. The ANOVA results of the GLMM are presented in Table S6.
IgM + refers to IgAN patients with the presence of IgM deposits. IgM– refers to IgAN patients with the absence of IgM deposits. Alb: serum albumin; S-Cr: serum creatinine; UACR: urine albumin/creatinine ratio.
![Figure 3. (A) Kaplan-Meier Curve displayed the prognosis of the IgM + and IgM– cohorts (p = 0.27 [log-rank test]). The endpoint was defined as either a reduction of ≥50% in baseline eGFR or the development of ESRD. (B) Estimated marginal means and corresponding SEs of serum creatinine levels were estimated and compared between IgM + and IgM– cohorts within the follow-up period using GLMM. (C) Estimated marginal means and corresponding SEs of urine albumin/creatinine ratio levels were estimated and compared between IgM + and IgM– cohorts within the follow-up period using GLMM. (D) Estimated marginal means and corresponding SEs of serum albumin levels were estimated and compared between IgM + and IgM– cohorts within the follow-up period using GLMM.Statistical significance levels are indicated in the plot as ‘*’, which represents p < 0.05, and ‘**’, representing p < 0.01. The ANOVA results of the GLMM are presented in Table S6.IgM + refers to IgAN patients with the presence of IgM deposits. IgM– refers to IgAN patients with the absence of IgM deposits. Alb: serum albumin; S-Cr: serum creatinine; UACR: urine albumin/creatinine ratio.](/cms/asset/2e822a46-04e6-4296-8268-dcbc6ae5f01e/irnf_a_2386146_f0003_c.jpg)
Figure 4. (A) Kaplan-Meier curve displayed the prognosis of the IgM-L and IgM-H cohorts (p = 0.02 [log-rank test]). The endpoint was defined as either a reduction of ≥50% in baseline eGFR or the development of ESRD. (B) Estimated marginal means and corresponding SEs of serum creatinine levels were estimated and compared between IgM-L and IgM-H cohorts within the follow-up period using GLMM. (C) Estimated marginal means and corresponding SEs of urine albumin/creatinine ratio levels were estimated and compared between IgM-L and IgM-H cohorts within the follow-up period using GLMM. (D) Estimated marginal means and corresponding SEs of serum albumin levels were estimated and compared between IgM-L and IgM-H cohorts within the follow-up period using GLMM.
Statistical significance levels are indicated in the plot as ‘*’, which represents p < 0.05, and ‘**’, representing p < 0.01. The ANOVA results of the GLMM are presented in Table S7.
IgM-H refers to IgAN patients whose IF intensity of IgM deposits exceeded 1+, while IgM-L represents IgAN patients whose IF intensity of IgM deposits was equal to 1+. Alb: serum albumin; S-Cr: serum creatinine; UACR: urine albumin/creatinine ratio.
![Figure 4. (A) Kaplan-Meier curve displayed the prognosis of the IgM-L and IgM-H cohorts (p = 0.02 [log-rank test]). The endpoint was defined as either a reduction of ≥50% in baseline eGFR or the development of ESRD. (B) Estimated marginal means and corresponding SEs of serum creatinine levels were estimated and compared between IgM-L and IgM-H cohorts within the follow-up period using GLMM. (C) Estimated marginal means and corresponding SEs of urine albumin/creatinine ratio levels were estimated and compared between IgM-L and IgM-H cohorts within the follow-up period using GLMM. (D) Estimated marginal means and corresponding SEs of serum albumin levels were estimated and compared between IgM-L and IgM-H cohorts within the follow-up period using GLMM.Statistical significance levels are indicated in the plot as ‘*’, which represents p < 0.05, and ‘**’, representing p < 0.01. The ANOVA results of the GLMM are presented in Table S7.IgM-H refers to IgAN patients whose IF intensity of IgM deposits exceeded 1+, while IgM-L represents IgAN patients whose IF intensity of IgM deposits was equal to 1+. Alb: serum albumin; S-Cr: serum creatinine; UACR: urine albumin/creatinine ratio.](/cms/asset/237dc07b-1f6b-45f1-80da-9a8359f3e810/irnf_a_2386146_f0004_c.jpg)
Table 2. Factors associated with reaching the composite endpoint in matched IgM-L and IgM-H cohort.
Table 3. Association between intensity of glomerular IgM deposit and composite endpoint (multivariate Cox regression model).
Supplemental materials.pdf
Download PDF (660.8 KB)Data availability statement
Data is not publicly available due to ethical reasons. Further enquiries can be directed to the corresponding author.