
Figures & data
Figure 1. Chains of Equivalence. Source: Author’s own elaboration.
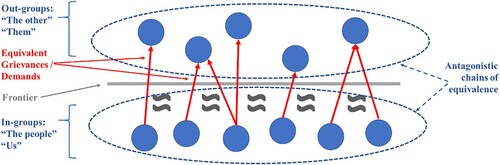
Image 1. Northern League rally in Venice, 7 October 2012. Source: Jean-Pierre Dalberá. Creative Commons Attribution 2.0 Generic.
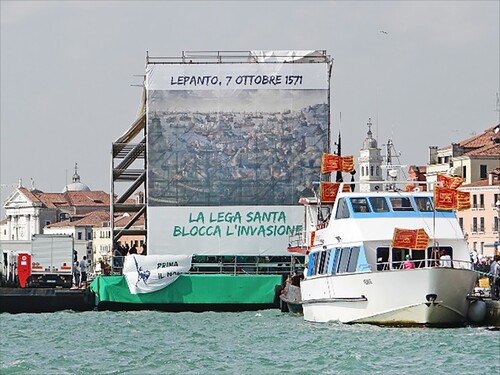
Image 2. Swiss People’s Party (SVP) posters. Source: Hansen (Citation2016:, 153).

Image 3. Mural Països Catalans, Vilassar de Mar, Catalonia, Spain. Source: Wikimedia Commons user “1997”, 29 July 2007, Creative Commons 3.0.
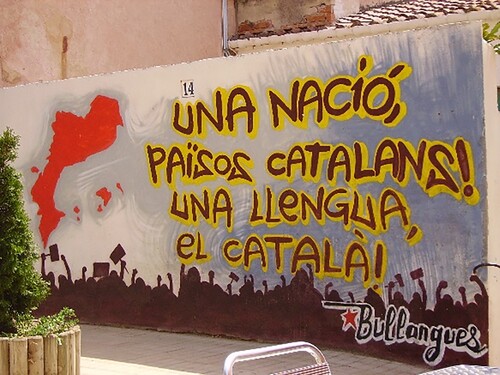
Image 4. Nigel Farage in front of UKIP poster for the Leave the European Union campaign in 2016. Source: Twitter Chris Ship @chrisshipitv, 16 June 2016

Table 1. Party manifestos analyzed.
Figure 2. Five-dimensional framework with examples of dimensions and typical populist and anti-populist features. Source: Olivas Osuna (Citation2021, 841)
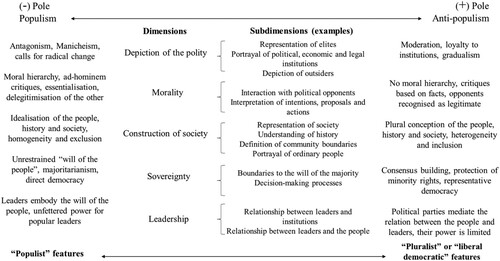
Figure 3. Populist references per 1,000 words.
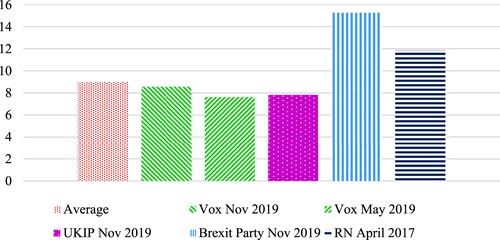
Figure 4. Populist references per dimension (references per 1,000 words).
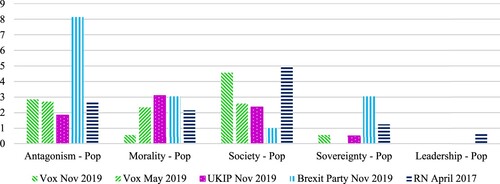
Figure 5. Borders references per 1,000 words.
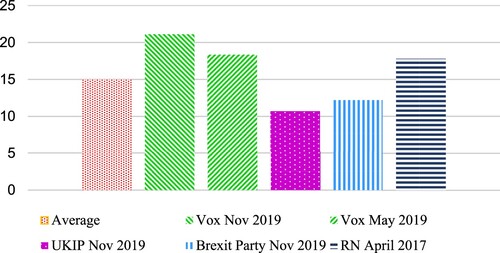
Figure 6. Map of code intersections. In parenthesis the total number of coded segments. Lines capture intersections with a minimal frequency of 5.
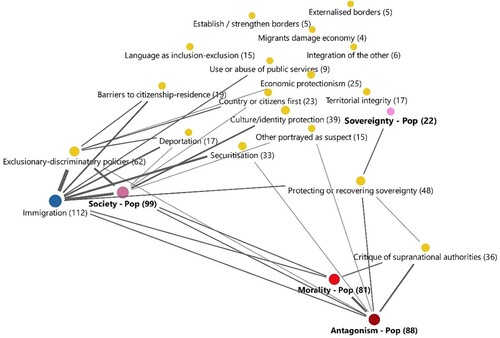
Table 2. Most frequent code intersections.