
Figures & data
Table 1. Included primary studies, treatment setting, and outcome measurements.
Figure 1. Common practice element frequencies for externalizing outcomes: winning groups and all trials.
Note: The bars represent the number of CPEs coded as “present” across comparisons. N = Total number of effect estimates for each comparison group. * p < .05 ** p < .01 *** p < .001
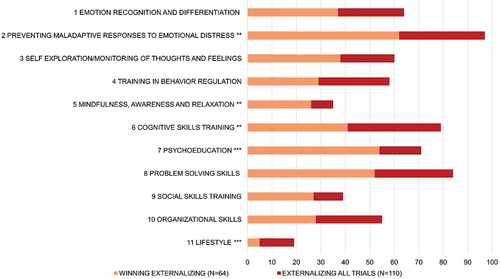
Figure 2. Common practice element frequencies for internalizing outcomes: winning groups and all trials.
Note: The bars represent the number of CPEs coded as “present” across comparisons. N = Total number of effect estimates for each comparison group. * p < .05 ** p < .01 *** p < .001
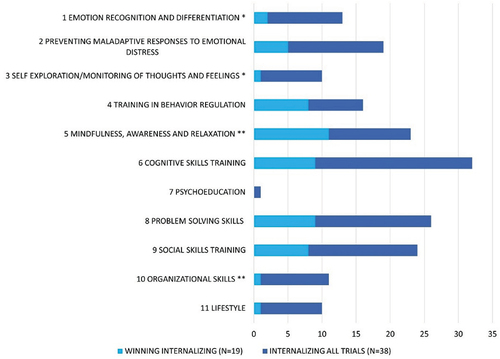
Table 2. Practice elements associated with stronger or weaker effects on externalizing symptoms.
Table 3. Practice elements associated with stronger or weaker effects on internalizing symptoms.
Supplemental material