
Figures & data
Table 1. Exclusion Criteria
Table 2. Baseline characteristics by treatment assignment
Figure 1. Standardized protocol (7 needles) for dry needling for temporomandibular disorder (TMD).
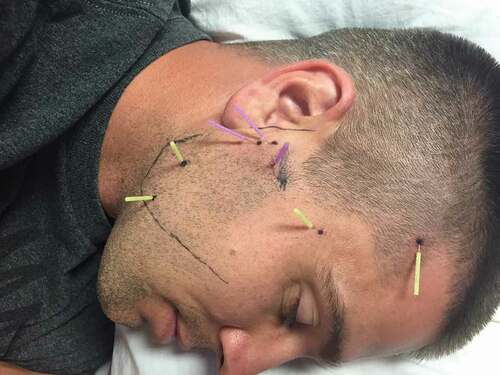
Figure 2. High-velocity low-amplitude thrust manipulation targeting the upper cervical spine.
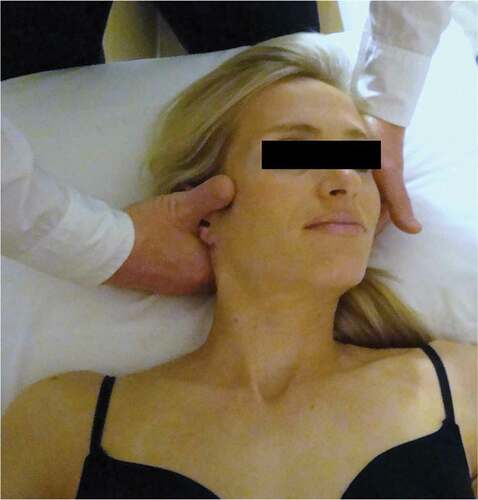
Figure 3. CONSORT flow diagram of patient recruitment and retention.
Table 3. Within-group and between-group mean scores by randomized treatment assignment
Figure 4. Evolution of average jaw pain intensity over the last 7 days (VAS) throughout the course of the study, stratified by randomized treatment assignment. Values are mean and 95% confidence interval.
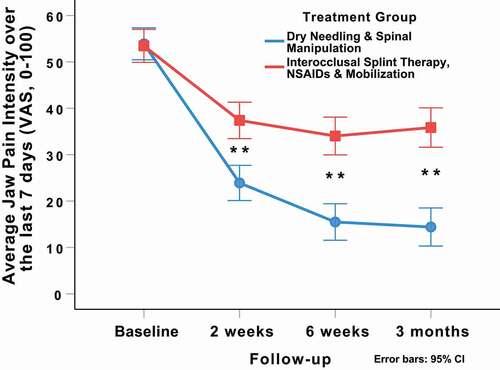
Figure 5. Evolution of active pain-free mouth opening (mm) throughout the course of the study, stratified by randomized treatment assignment. Values are mean and 95% confidence interval.
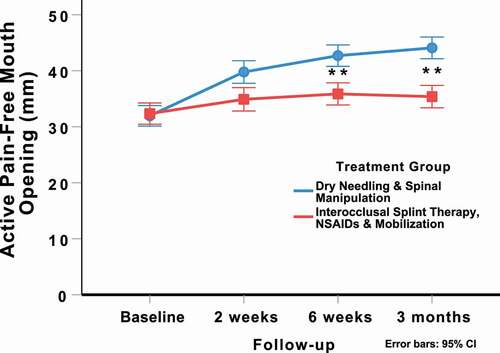
Figure 6. Evolution of jaw pain intensity over the past 24 hrs (VAS) throughout the course of the study, stratified by randomized treatment assignment. Values are mean and 95% confidence interval.
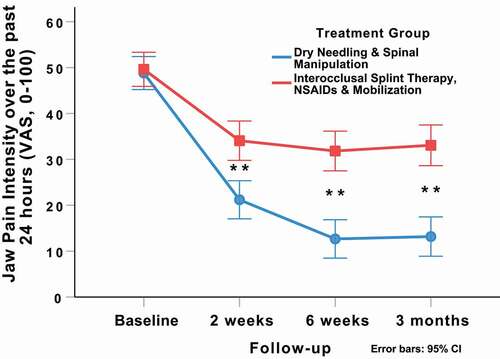
Table 4. Self-perceived improvement measured with the Global Rating of Change (GROC) in both groups [n (%)]