Figures & data
Figure 1. Overview of MASSIF-1 and the crystal location process. (a) View of the MASSIF-1 experimental hutch. The RoboDiff is shown in the goniometer position. (b) A sample support after optical centring. (c) The result of the mesh area determination is shown (red box), in this case the smallest orientation has been selected. (d) The output from the mesh scan. Diffraction images are scored by intensity distribution as a function of resolution. The centre of mass is calculated between positions within 50% of each other and used as the point for centring (white cross).
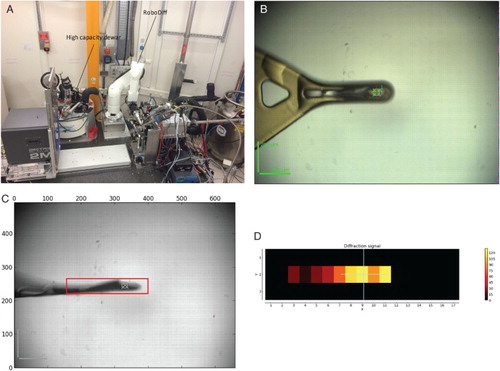
Table 1. Diffraction plan entries.
Figure 2. Geographical distribution of the 9872 crystals sent to MASSIF-1 from across Europe in 2015. Circles are scaled to the number of crystals and are centred on the city where the laboratory responsible is based. The colour is scaled to the number of different projects (protein acronyms) from each BAG.
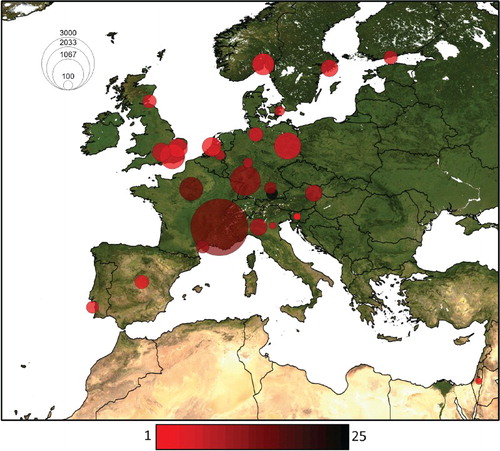
Figure 3. Robots do not sleep. Data collection totals by the hour in which they were started are shown as a 24 h clock for MASSIF-1 (left) and the other 7 MX beamlines at the ESRF (right) in 2015. There is a significant contrast in the proportion of data collections started after midnight, which drop continually on human-operated beamlines but remains steady on MASSIF-1. The drop in productivity maps closely to the decrease in mean relative performance in cognitive tests performed after hours of sustained wakefulness (right, black bars, central scale) assuming awakening at 07:00 (data from [Citation49]). Dips at mealtimes (13:00 and 20:00) are also absent for MASSIF-1. It should be noted that the period 08:00 to 09:30 is reserved for beamline startup on the human operated beamlines.
![Figure 3. Robots do not sleep. Data collection totals by the hour in which they were started are shown as a 24 h clock for MASSIF-1 (left) and the other 7 MX beamlines at the ESRF (right) in 2015. There is a significant contrast in the proportion of data collections started after midnight, which drop continually on human-operated beamlines but remains steady on MASSIF-1. The drop in productivity maps closely to the decrease in mean relative performance in cognitive tests performed after hours of sustained wakefulness (right, black bars, central scale) assuming awakening at 07:00 (data from [Citation49]). Dips at mealtimes (13:00 and 20:00) are also absent for MASSIF-1. It should be noted that the period 08:00 to 09:30 is reserved for beamline startup on the human operated beamlines.](/cms/asset/77b8835c-10c7-4148-921d-739e7c7cbc19/gcry_a_1155050_f0003_c.jpg)
Figure 4. Seeing is not believing. A crystal is shown after an X-ray centring procedure; visual inspection suggests that the crystal is not centred as the beam appears to be above the crystal (left). However, the collection of four diffraction images over the full rotation range confirmed that the crystal remained in the beam over the full rotation range. Fortunately, in this case part of the crystal extends beyond the sample support where refractive and reflective effects are diminished, showing the true position of the crystal (right). Using this as a reference (red line), it can be seen that the crystal is indeed correctly centred to the beam position, demonstrating a 10 µm optical vertical offset.
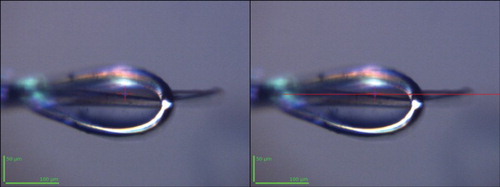
Table 2. The use of crystal volumes in strategy calculations.
Figure 5. Distribution of measured crystal dimensions and exposure times for data collections on MASSIF-1. (a) Lognormal distributions of the observed crystal dimensions from 2015 crystals. The dimensions are: x the measured crystal length parallel to the spindle axis, y the length orthogonal to the spindle axis and z the length orthogonal to the spindle axis 90° away in ω. Representations of an average and modal crystal are shown for illustrative purposes. (b) Lognormal distributions of total data collection times in 2015. A much wider distribution is observed for strategies calculated using EDNA where the crystal volume, diffraction quality and beam properties are used in the calculation.
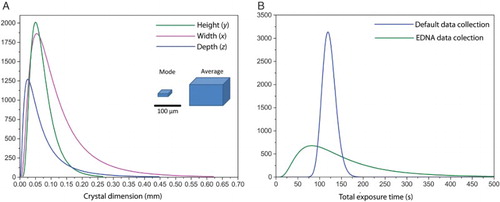
Figure 6. Distribution of ⟨I/σ(I)⟩ values for data sets automatically processed on MASSIF-1 and the ESRF human-operated beamlines in 2015. Lognormal distributions of the ⟨I/σ(I)⟩ values from data sets from MASSIF-1 (green) and other ESRF beamlines (black). The distributions are very similar in shape but there is a significant shift to higher values for MASSIF-1.
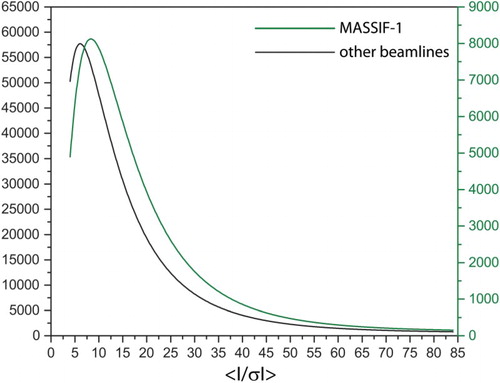
Figure 7. Crystal attrition on MASSIF-1 for all crystals and various types of individual project. (a) The fate of all crystals sent to MASSIF-1 in 2015 is shown. Of all samples sent, around one-third do not diffract or are empty loops; one-third diffract, but cannot be processed and the final third yield a processed data set. (b) A phasing project where crystals vary considerably in their quality, only 14% yielded a processed data set, two of these were >dmin 4 Å and 1 allowed the structure to be solved. (c) A screening project for a membrane protein. No crystals could be indexed initially, three of the default collections could be processed. (d) A fragment-based drug design project. A near 100% yield in data sets to look for small molecule binding.
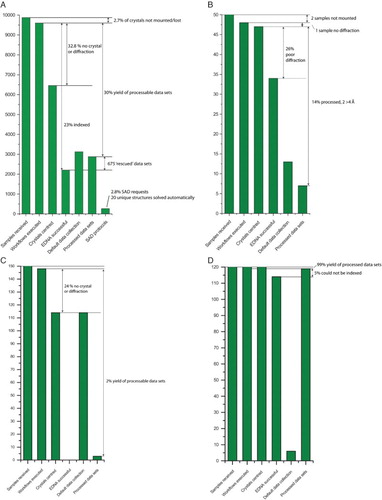
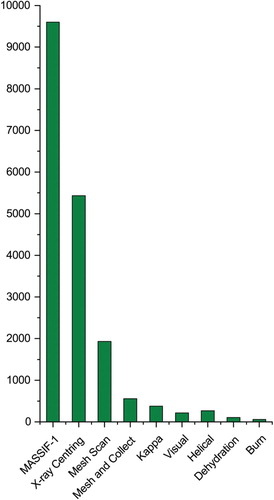
Figure 8. The impact of MASSIF-1 technology on the human-operated ESRF MX beamlines in 2015. The number of workflows launched by type is shown. The X-ray centring routine developed for MASSIF-1 has been highly successful on the other ESRF beamlines and is the most popular workflow run when users are present. ‘Kappa’ is a κ-goniometer reorientation, ‘Visual’ is a reorientation of the κ-goniometer along a user-defined line; ‘Helical’ takes two user-defined points on needle crystal and calculates an optimized strategy given translation of the crystal between the points; ‘Dehydration’ performs a dehydration gradient on a crystal while analysing the effects on the diffraction and ‘Burn’ determines a crystal's radiation sensitivity experimentally.