
Figures & data
Table 1. Sample description.
Figure 1. Rates of treatment initiation and engagement in adults and adolescents, 2010–2015. Solid black line: Adolescent treatment initiation rate. Solid gray line: Adult treatment initiation rate. Dashed black line: Adolescent treatment engagement rate. Dashed gray line: Adult treatment engagement rate.
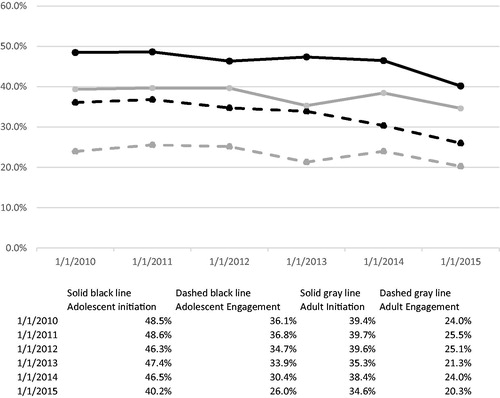
Table 2. Bivariate tests of treatment initiation and engagement.
Table 3. Logistic regression results for treatment initiation.
Table 4. Logistic regression results for treatment engagement.