Figures & data
Figure 1. 13C -NMR spectra of D-[1-13C]-mannitol and its metabolites at 6 h (a) and 24 h (b) of incubation.
![Figure 1. 13C -NMR spectra of D-[1-13C]-mannitol and its metabolites at 6 h (a) and 24 h (b) of incubation.](/cms/asset/93b7fdc4-2541-4c74-a5ca-3a31216f749f/zmeh_a_143056_f0001_b.jpg)
Figure 2. Degradation of D-[1-13C]-mannitol (•) (a) and the evolution of 13C-labeled short-chain fatty acids (b). ○, [3-13C]-propionate; ♦, [2-13C]-butyrate; ⋄, [4-13C]-butyrate; •, [2-13C]-propionate; ▴, [2-13C]-acetate; ![]()
![Figure 2. Degradation of D-[1-13C]-mannitol (•) (a) and the evolution of 13C-labeled short-chain fatty acids (b). ○, [3-13C]-propionate; ♦, [2-13C]-butyrate; ⋄, [4-13C]-butyrate; •, [2-13C]-propionate; ▴, [2-13C]-acetate; Display full size, [2-13C]-valerate; Display full size, [3-13C]-butyrate.](/cms/asset/75de9bcf-48cd-4153-a603-2b8d8981beb5/zmeh_a_143056_f0002_b.jpg)
Table I. Concentration (mmol/kg water in cecal contents) of short-chain fatty acids of cecal digesta of rats on day 0 and at the end of the experiment (day 22).
Figure 3. Gel images of temperature gradient gel electrophoresis (TGGE) on bacterial 16S rRNA genes retrieved from feces and cecal digesta of one rat from group C (a), one from group 5M (b) and one from group 10M (c). B, at the introduction of rat; 0, day 0; 1, day 1; 3, day 3; 10, day 10; 22, day 22; 22C, cecal digesta on day 22.
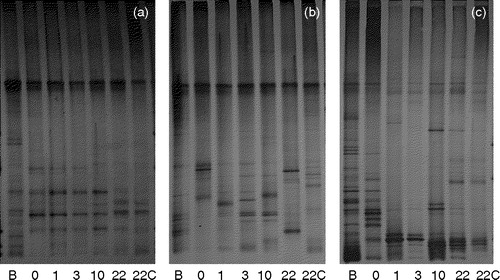
Figure 4. Dendrograms calculated from the TGGE band profiles of one rat from group C, group 5M, or group 10M. For details see legend to .
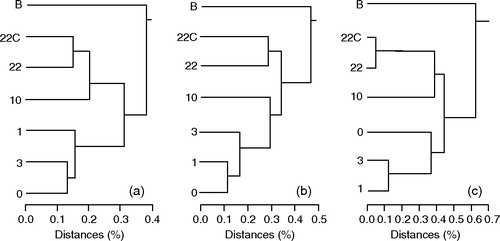
Table II. Name of bacteria suggested by BLAST search on cloned 16S rRNA genes from rat feces.