3,162
Views
32
CrossRef citations to date
0
Altmetric
ORIGINAL ARTICLE

Methanogenic archaea in adult human faecal samples are inversely related to butyrate concentration

, &
Pages 154-160 | Received 06 Mar 2006, Published online: 11 Jul 2009

Figures & data

Figure 1.  Concentration of methanogen DNA (ng/gww) in human faecal samples over a 14 week period. •λ, volunteer 2; □, volunteer 6; ▴, volunteer 8; ▾, volunteer 5 and • volunteer 4.
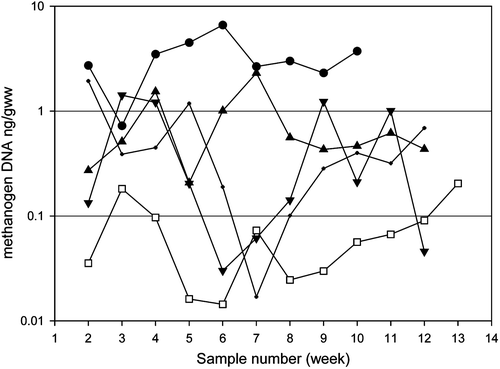
Figure 1.  Concentration of methanogen DNA (ng/gww) in human faecal samples over a 14 week period. •λ, volunteer 2; □, volunteer 6; ▴, volunteer 8; ▾, volunteer 5 and • volunteer 4.

Figure 2.  Relationship of methanogen 16S rDNA gene abundance and faecal butyrate concentration. Methanogen and butyrate concentration averaged over 12 weeks of the study. Error bars show standard error.
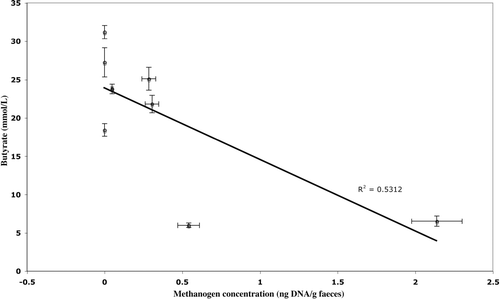
Figure 2.  Relationship of methanogen 16S rDNA gene abundance and faecal butyrate concentration. Methanogen and butyrate concentration averaged over 12 weeks of the study. Error bars show standard error.

Figure 3.  Relationship between faecal pH and faecal butyrate concentration. Error bars show standard error.
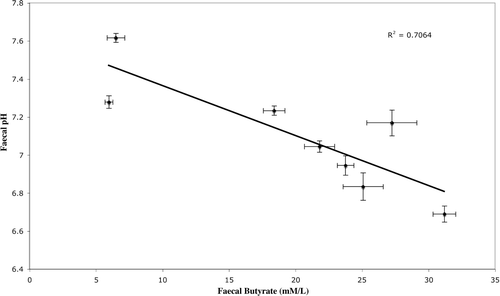
Figure 3.  Relationship between faecal pH and faecal butyrate concentration. Error bars show standard error.

Figure 4.  Relationship between methanogen 16S rRNA gene abundance and faecal pH for individuals in which methanogens were detected. Error bars show standard error.
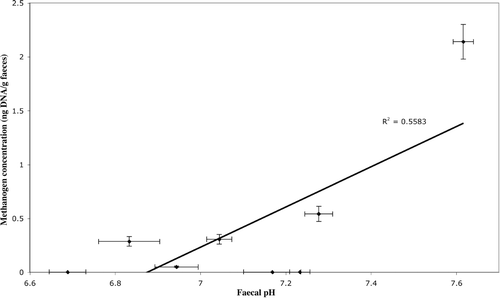
Figure 4.  Relationship between methanogen 16S rRNA gene abundance and faecal pH for individuals in which methanogens were detected. Error bars show standard error.

Table I.  Pearson's moment correlation of faecal methanogen abundance, relative bacterial abundance and pH versus pH, bacterial abundance and SCFA concentrations.