3,399
Views
7
CrossRef citations to date
0
Altmetric
REVIEW ARTICLE

The Spanish flu as a worst case scenario?

&
Pages 1-26 | Received 25 May 2007, Published online: 11 Jul 2009

Figures & data

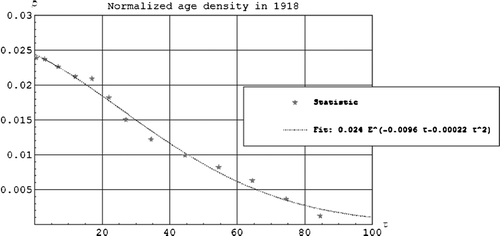
Figure 1.  The normalized age density as a function of the age τ in years.

Figure 1.  The normalized age density as a function of the age τ in years.

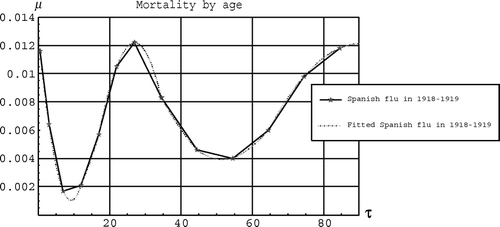
Figure 2.  The mortality by age µ(τ) as a function of age τ in years.

Figure 2.  The mortality by age µ(τ) as a function of age τ in years.

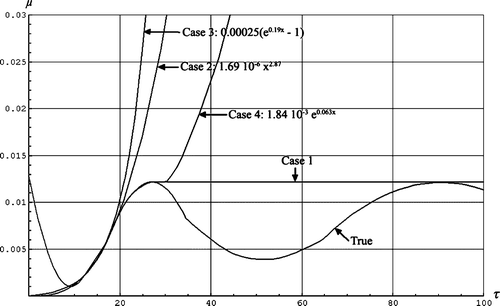
Figure 3.  The mortality by age µ(τ) as a function of age τ in years for the scenarios.

Figure 3.  The mortality by age µ(τ) as a function of age τ in years for the scenarios.

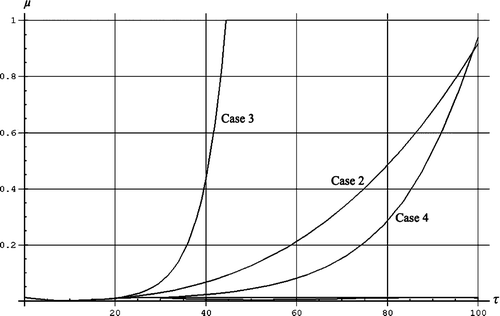
Figure 4.  The mortality by age µ(τ) as a function of age τ in years for the scenarios.

Figure 4.  The mortality by age µ(τ) as a function of age τ in years for the scenarios.

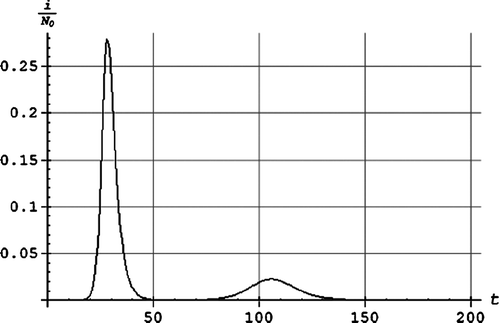
Figure 5.  The number of infected individuals in wave 2 relative to the population size as a function of time in days.

Figure 5.  The number of infected individuals in wave 2 relative to the population size as a function of time in days.

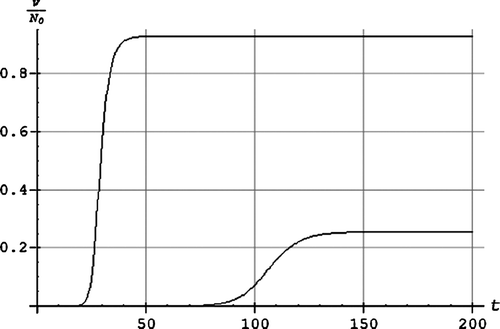
Figure 6.  The number of affected individuals in wave 2 relative to the population size as a function of time in days. From above: (a) assuming the second wave of the Spanish flu came before the first wave, (b) the second wave of the Spanish flu.

Figure 6.  The number of affected individuals in wave 2 relative to the population size as a function of time in days. From above: (a) assuming the second wave of the Spanish flu came before the first wave, (b) the second wave of the Spanish flu.