Figures & data
TABLE 1 Increase in Indebtedness (Percent of GDP), 2000–2007
Figure 1 The Eurozone: The Increase in Sovereign Debt Is Not Associated with Increased Real GDP (2000–2007)
Sources: See sources to Table .
Notes: Δ real GDP = the percentage increase in real GDP (2000–2007); Δ government debt = the increase in government debt as a percentage of GDP (during 2000–2007). The (dashed) horizontal line indicates that there is no statistically significant (at 10 percent or less) association between Δ government debt and Δ GDP.
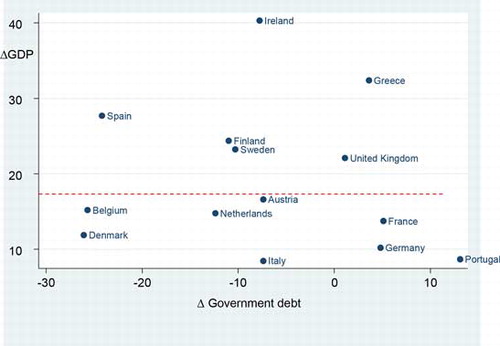
Figure 2 The Eurozone: The Increase in Household Debt Is Associated with an Increase in Real GDP (2000–2007)
Sources: See sources for Table .
Notes: The regression line is based on the following ordinary least squares (OLS) regression:
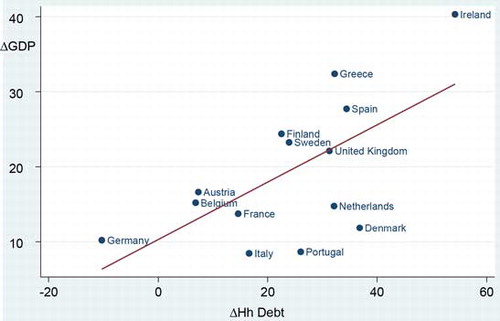
Figure 3 Higher Household Debt Is Associated with Higher Home Prices in the Eurozone
Sources: See sources for Table .
Notes: The regression line is based on the following OLS regression:
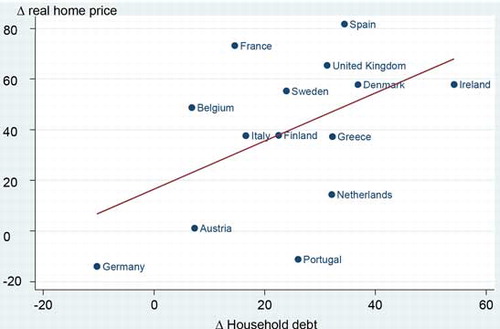
Figure 4 Higher Home Prices Are Correlated with Higher GDP Growth in the Eurozone
Sources: See sources for Table .
Notes: The regression line is based on the following OLS regression:
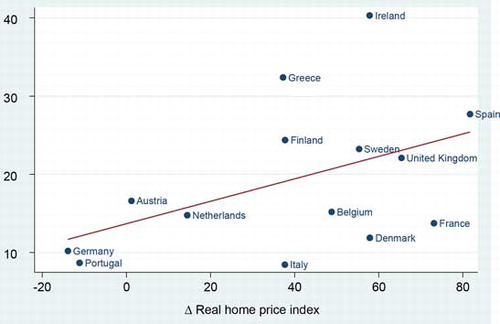
TABLE 2 Debts (percent of GDP), 2012
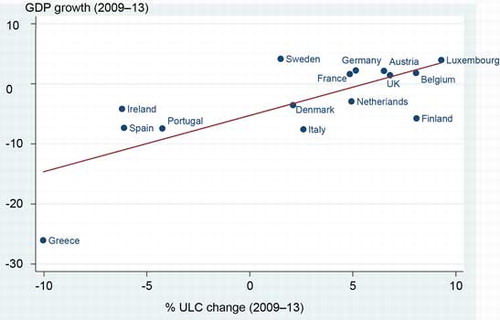
Figure 5 Postcrisis GDP Growth (2009–2013) Is Not Correlated with Precrisis Changes in Unit Labor Costs (2000–2008)
Sources: Authors’ estimations based on Eurostat Data on nominal unit labor costs (http://ec.europa.eu/eurostat/tgm/table.do?tab=table&init=1&language=en&pcode=tipslm20&plugin=1) and unemployment (http://ec.europa.eu/eurostat/tgm/table.do?tab=table&init=1&language=en&pcode=tipsun20&plugin=1).
Notes: The conclusion from the OLS regression analysis is that there is no statistically significant association between the (percentage) change in unit labor costs (2000–2008) and real GDP growth (2009–13). The results are sensitive to the outlier observations for Greece, Luxembourg, and even Italy and Spain; when we control for these “outliers” (using country dummies for the mentioned countries), the estimated coefficient of percentage of ULC change on real GDP growth is not significant (at 10 percent)
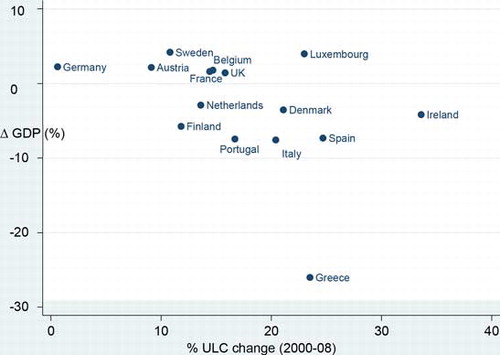
TABLE 3 Unit Labor Costs and Gross Output Prices (mid-2000s)
Figure 6 Does higher unit labour cost lead to higher unemployment?” (a) Changes in ULC (2001–2009) and in the unemployment rate (2009–13) [reproduced from Informal European Council (Citation2015)]. (b) Changes in ULC (2009–13) and in the unemployment rate (2009–13) [reproduced from Janssen (Citation2015)].
Sources: See sources for Figure .
![Figure 6 Does higher unit labour cost lead to higher unemployment?” (a) Changes in ULC (2001–2009) and in the unemployment rate (2009–13) [reproduced from Informal European Council (Citation2015)]. (b) Changes in ULC (2009–13) and in the unemployment rate (2009–13) [reproduced from Janssen (Citation2015)].Sources: See sources for Figure 5.](/cms/asset/856c3d51-5267-456c-8c38-a468397dcca1/mijp_a_1159084_f0006_oc.jpg)
Figure 7 Postcrisis Eurozone (2009–2013): Internal Devaluations Are Killing Economic Growth
Sources: See sources for Figure .
Notes: The OLS regression is: