
Figures & data
Figure 1. Map of the Northern Hemisphere with locations of samples used in this study. Extant species are represented by circles and fossil species represented by triangles.
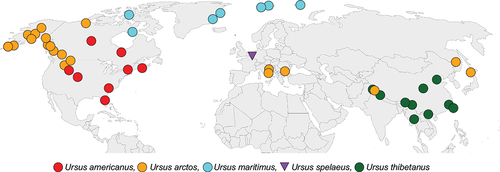
Table 1. Specimens used for this study by species and skeletal element from the mandible, i.e. whole mandible, Corpus only and Ramus only.
Figure 2. (left) anatomical nomenclature of right hemi-mandible and (right) landmark configuration for hemi-mandibles in lateral view (U. spelaeus - SC 92-503-01). Scale bar: 4.0cm. Refer to for landmark definitions.
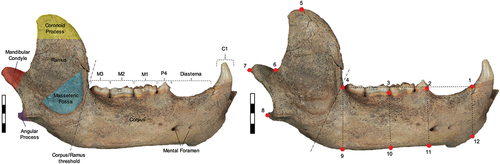
Table 2. Definition and numbering sequence of landmarks for lateral hemi-mandibles.
Figure 3. PCA plot of mandibular morphology across species for the (a) whole mandible (b) corpus and (c) ramus. Allometry plots of PC1 against logCS for (d) whole mandible, (e) corpus and (f) ramus. Deformation grids and two-coloured wireframes show mean shape (light blue) and deformation (dark blue) at the extremity of each axis for each PC.
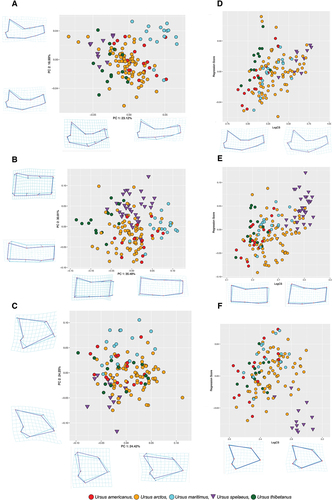
Table 3. Procrustes ANOVA models testing for association between shape and size vs the factor species and allometric patterns for each mandible dataset. Significance indicated in bold.
Table 4. Pairwise comparisons of shape and size (logCS) (above and below the main diagonal, respectively) between species and stratigraphic units for U. spelaeus for whole mandible, corpus and ramus datasets expressed with p values. Significance indicated in bold. All pairwise comparisons between stratigraphic layers of U. spelaeus are highlighted in a grey box.
Figure 4. Boxplots showing differences in log centroid size (logCS) of whole mandible, corpus and ramus specimens across all species of Ursus.
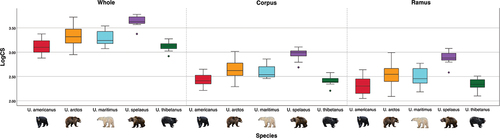
Figure 5. Scatterplot of the first pair of PLS of shape and climate by: species (a, b and c) and Köppen-Geiger climate classification (d, e and f) for whole mandible (a and d), corpus (b and e) and ramus (c and f) datasets. Deformation grids and two-coloured wireframes show mean shape (light blue) and deformation (dark blue) at the extremity of the first axis. All stratigraphic unit specimens = U. spelaeus.
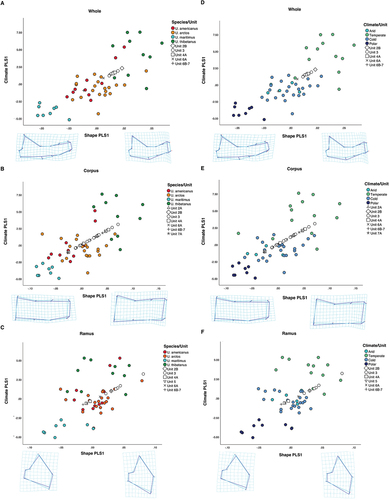
Figure 6. Scatterplot of the predicted PLS scores of shape by: species (a, b and c) and Köppen-Geiger climate classification (d, e and f) for whole mandible (a and d), corpus (b and e) and ramus (c and f) datasets. Deformation grids and two-coloured wireframes show mean shape (light blue) and deformation (dark blue) at the extremities of both x and y axes. All stratigraphic unit specimens = U. spelaeus.
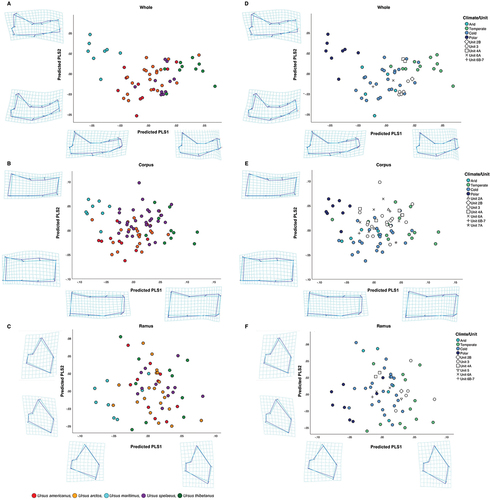
Table 5. Summary of variation by the first two axes of DFAs on the Whole mandible, Corpus and Ramus datasets. Significance indicated in bold.
Table 6. Percentage of cross-validated correctly classified cases of each climate classification for discriminant function analysis for each dataset (whole mandible, corpus and ramus) on extant bear species. Percentages of correctly classified cases are in bold.
Table 7. Predicted Köppen-Geiger climate classifications for U. spelaeus specimens from different stratigraphic units of Scladina Cave for shape in each dataset (whole mandible, corpus and ramus) based on DFA models.