Figures & data
Figure 1 Hypomethylated DNA in constitutive heterochromatin in ICF. Cartoon illustrating the constitutive heterochromatin regions that display ICF-specific hypomethylation and chromosome abnormalities. Dark gray box, juxtacentromeric (pericentromeric) heterochromatin; white box, centromere.
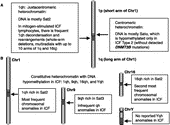
Table I. Immune system-related genes with significant differences in RNA levels in ICF vs. control lymphoblasts.
Table II. More genes with significantly altered RNA levels in ICF vs. control lymphoblasts.
Figure 2 Analysis of DNA methylation upstream of PTPN13. Representative COBRA analysis for DNA methylation of a gene that had RNA upregulated in ICF vs. control LCLs. DNA samples had been modified with bisulfite and amplified by PCR with primers at the indicated positions as previously described [Citation5]. The PCR products could be cleaved by TaqI or BstUI only if they had been methylated at the CpG dinucleotide in the indicated sites in genomic DNA; the pre-TaqI site, CCGA, would be converted to a TaqI site, TCGA, upon bisulfite treatment and PCR if it was Cm5 CGA in genomic DNA. (A) Diagram of the 5′PTPN region showing the transcription start site (TSS) [Citation123] at Chr4 87,734,909 (hg18, UCSC database), the 5′CpG island ( − 701 to − 150), and PCR primers; positions are given relative to the TSS. (B) and (C), electrophoresis gels stained with ethidium bromide and visualized for fluorescent bands from the PCR products ( − 628 to − 119 and − 1250 to − 940) digested with BstUI or TaqI. PBMC, peripheral blood mononuclear cells; ICF LCLs are described in the legend to , with the addition of another control LCL (AG14832, Coriell Institute). Sizes are given in bp for the expected and obtained restriction products.
![Figure 2 Analysis of DNA methylation upstream of PTPN13. Representative COBRA analysis for DNA methylation of a gene that had RNA upregulated in ICF vs. control LCLs. DNA samples had been modified with bisulfite and amplified by PCR with primers at the indicated positions as previously described [Citation5]. The PCR products could be cleaved by TaqI or BstUI only if they had been methylated at the CpG dinucleotide in the indicated sites in genomic DNA; the pre-TaqI site, CCGA, would be converted to a TaqI site, TCGA, upon bisulfite treatment and PCR if it was Cm5 CGA in genomic DNA. (A) Diagram of the 5′PTPN region showing the transcription start site (TSS) [Citation123] at Chr4 87,734,909 (hg18, UCSC database), the 5′CpG island ( − 701 to − 150), and PCR primers; positions are given relative to the TSS. (B) and (C), electrophoresis gels stained with ethidium bromide and visualized for fluorescent bands from the PCR products ( − 628 to − 119 and − 1250 to − 940) digested with BstUI or TaqI. PBMC, peripheral blood mononuclear cells; ICF LCLs are described in the legend to Table I, with the addition of another control LCL (AG14832, Coriell Institute). Sizes are given in bp for the expected and obtained restriction products.](/cms/asset/c9f633dd-4e07-41b9-a938-6d0f2bdc7774/iaut_a_302588_f0002_b.gif)