Figures & data
Figure 1. (A–E) Axial FLAIR (A and B) demonstrate at time of the acute onset scattered hyperintensive lesions in the white matter of centrum semiovale and subcortically in both hemispheres. Some of these lesions demonstrated reduced diffusion on DWI (C) and ADC (D) maps suggestive of acute small ischemic events. The 3DToF (Time-of-Flight) MR angiography (E) of the intracranial vessels demonstrated normal vessels without evidence of vasculitis or stenosis.
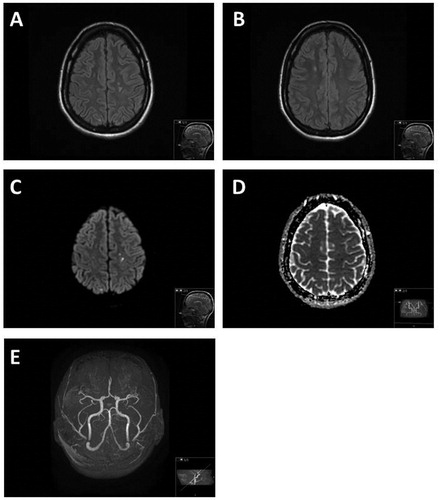
Figure 2. (A and B) Laboratory data. (A) Autoantibodies detected by ALBIA; anti-dsDNA (ref. <80 IU/mL), anti-Ro60/SSA (ref. <50 IU/mL) and anti-La/SSB (ref. <40 IU/mL). (B) Complement proteins C3 (ref. 0.70–1.3 g/L) and C4 (ref. 0.13–0.32 g/L). Weeks indicate time since SLE onset.
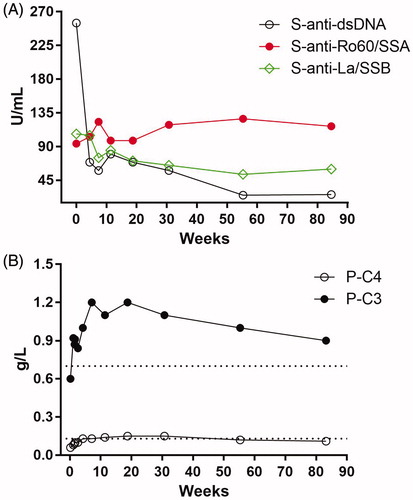
Figure 3. (A–C) Mitral valve samples show thick fibrin and fibrotic layers, lymphocytes and neutrophil granulocytes. No signs of fungi or bacteria and the findings were suggestive of non-bacterical trombotic endocarditis (A). Complement, IgG deposition and neutrophil markers (B and C). Fluorescence microscopic images of C1q, C3c, IgG, neutrophil elastase (NE) and citrullinated histone H3 (citH3) in the patient with Libman–Sacks endocarditis (B) compared with the individual with healthy mitral valve (C). Depicted are fluorescence images of tissue samples stained with PI (red), immunofluorescence images of C1q, C3c, IgG, NE and citH3 (Cy5, green) and an overlay of the respective images (Merge). The fluorescence images were taken at a magnification (20×, 300 µm × 300 µm) of the area indicated in the H&E staining (red box) of the complete sample in 4× magnification (B and C).
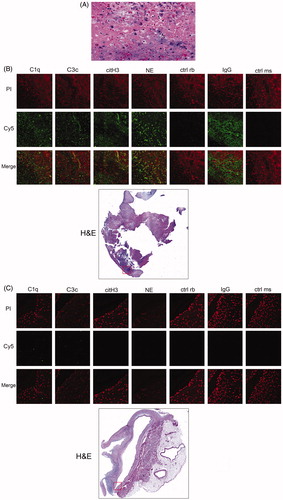
Figure 4. (A and B) Laboratory of data: (A) CSF markers of damage and immune activation; IgG (ref. <38 mg/L), Tau (ref. <300 ng/L) and NFL (ref. <380 ng/L). (B) Left panel; serum NET remnants (filled circles) and neutrophil count (open circles) in serial blood samples from the patient. Weeks indicate time since SLE onset. Right panel; comparisons of NET remnants of the patient and healthy controls in sera and CSF, respectively. **p = .0011.
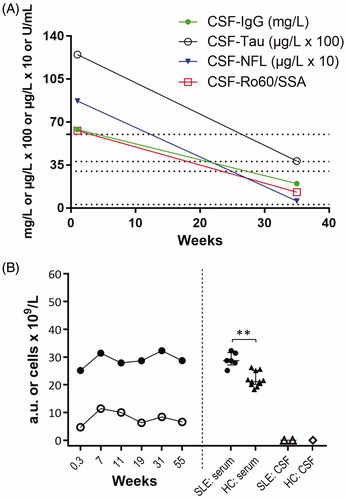
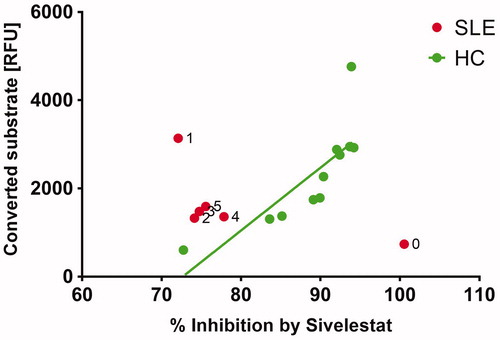
Figure 5. The baseline sample (0) from the patient shows rather low neutrophil elastase (NE) activity but this activity was completely inhibitable by sivelestat. Follow-up samples (1–5) were not fully inhibitable by sivelestat. In healthy controls (HC) the amount of converted substrate correlates significantly (p < .003) with inhibition by sivelestat. These results suggest that the specific activity of NE in serum was strongly modulated during the disease course and provided therapies.