Figures & data
Figure 1. Flowchart of children screened at birth and followed in the DiPiS study to 10 years of age, and the distribution of thyroid autoantibodies in the population.
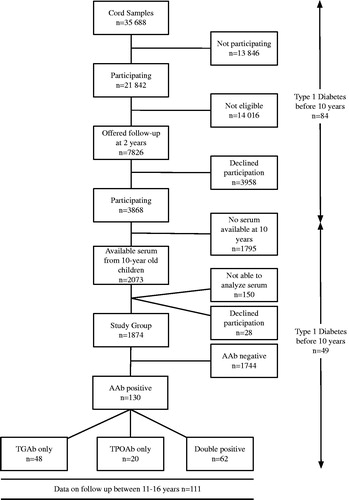
Table 3. Correlations between TPOAb and TGAb levels in thyroid autoantibody positive children.
Figure 2. QQ plot showing the distribution and cut off for (a) TGAb levels (93 dots lie above the scale) and (b) TPOAb levels (60 dots lie above the scale) in 10-year-old children in the DiPiS study.
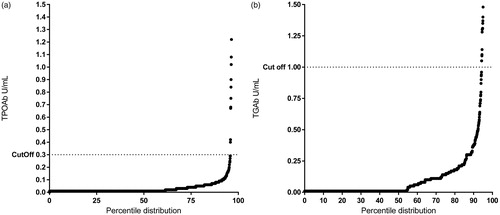
Figure 3. TPOAb and TGAb levels in females and males positive for thyroid autoimmunity at 10 years. Test; Wilcoxon.
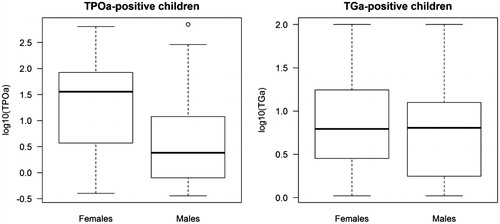
Table 1. Associations between islet autoantibodies and autoantibodies against TPO and TG at 10 years, χ2 test and fishers exact were used for analysis.
Table 2. Correlation between islet autoantibody and thyroid autoantibody levels in islet autoantibody positive children.
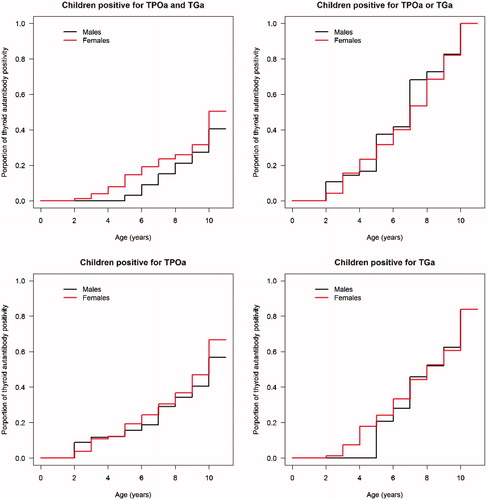
Figure 4. The age of TPOAb and TGAb appearance in thyroid autoantibody positive children. Panel; (a) Children positive for TPOAb and TGAb, (b) Children positive for TPOAb or TGAb, (c) Children positive for TPOAb and (d) Children positive for TGAb.