
Figures & data
Figure 1. Two independent approaches for longitudinal sampling of healthy individuals, DHR in Finland and S3WP in Sweden, display differences in sampling strategy (A) as well as age span (B). Top dots correspond to the dates of the five visits of DHR-subjects and bottom dots correspond to the dates of the four visits of S3WP-subjects.
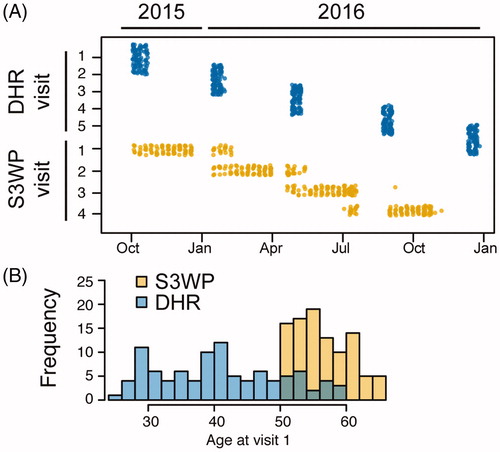
Figure 2. (A) Autoantibody profiles displayed as person specific barcodes show the individuality and stability over time of autoantibody repertoires. (B) The personal autoantibody signature causes the subject’s samples from four or five visits to cluster together when applying a dimensionality reduction of the two datasets combined, using data transformed into 17 discrete reactivity scores.
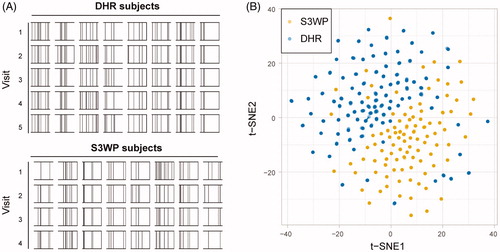
Figure 3. (A) The two independent cohorts reveal almost identical distribution of average number of reactivities per subject across the 335 antigens. (B) No correlation was found between age and sex with the average number of reactivities.
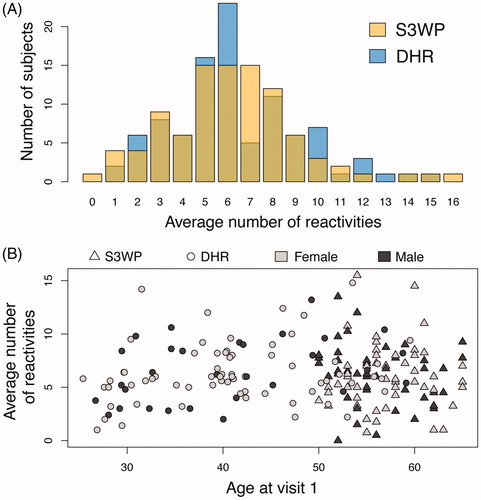
Figure 4. Autoantibody binding towards the selected set of 335 human antigens is person specific and stable over repeated sampling over one year. Shown here are the subjects with the highest number of reactivities (A, B), the subjects with the lowest number of reactivities (C, D), and exemplified subjects with reactivities occuring during the timespan of each study (E, F). Antigens that are classified as reactive at any visit are interconnected by dashed lines.
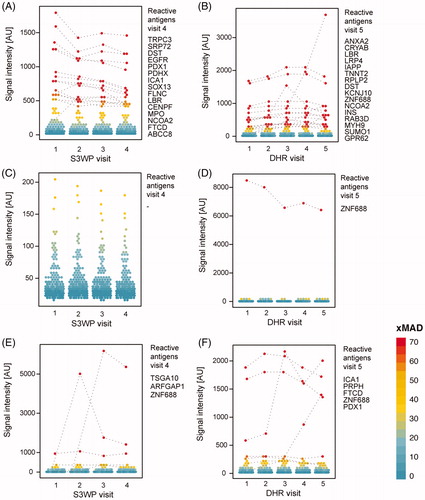
Figure 5. IgG reactivity towards a high density human protein array for visit 1 samples for the four subjects with the highest (A and C) and lowest (B and D) number of reactivities in the targeted array. (E) These four individuals were identified to display approximately similar numbers of reactivities on the high density array when applying a stringent cut-off for reactivity.
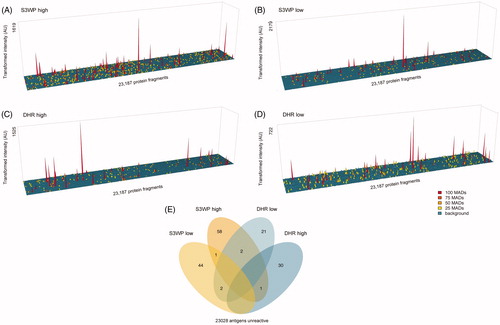
Figure 6. Classification of target protein fragments based on data from the S3WP individuals and the DHR individuals. In each cohort, about half of the analysed protein fragments were unreactive. Ten antigens were identified to be highly reactive in both cohorts, whereas three antigens were highly reactive in DHR and group reactive in S3WP.
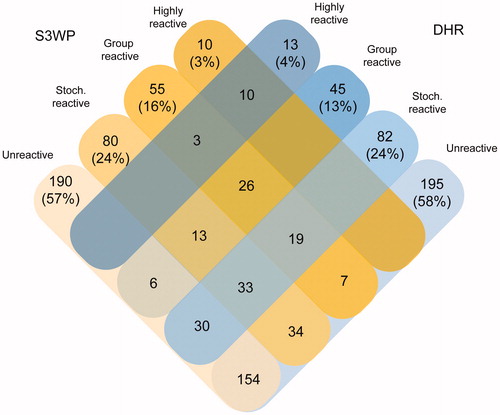
Figure 7. (A) Autoantibody reactivities of 193 individuals (visit 1) towards 13 antigens identified as highly reactive. (B) ZNF688 was discovered as the antigen with IgG binding in the most samples. (C) Reactivity plots for IgG binding to TRIM21, also known as SSA or Ro52. (D) Reactivity plots for IgG-binding to KCNJ10, also known as KIR4.1. The binding fluorescence intensity is plotted for each individual at each time point for the S3WP subjects and the DHR subjects. Data points which were classified as reactive by the stringent cut-off are interconnected by a dashed line connecting data points from the same individual.
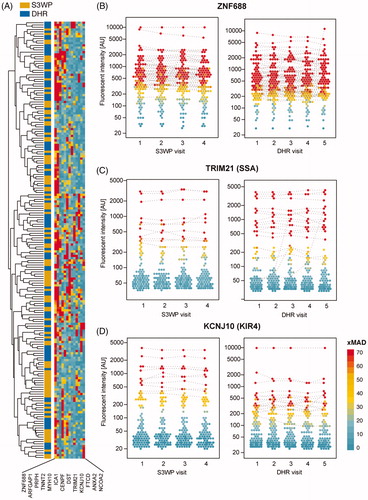
Table 1. Highly reactive antigens.