Figures & data
Table 1. Demographic and serological data of all 53 investigated patients.
Figure 2. Presentation of alterations in frequencies of different IL-10-producing B and regulatory B cells within total lymphocytes (A-D) and CD19+ B cells (E-H) in study groups including: CD19+IL-10+ (A, E), CD19+CD24+CD27+IL-10+ (B, F), CD1d+CD5+CD19+IL-10+ (C, G), CD1d+CD5+CD24+CD27+IL-10+ (D, H).
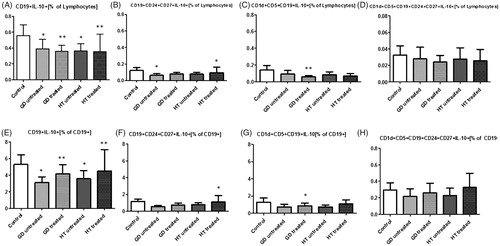
Figure 3. Graphical presentation of changes in IL-10 production within total CD19+ B cells (A) and 3 different phenotypes of regulatory B cells: CD24+CD27+CD19+ (B); CD1d+CD5+CD19+ (C); CD1d+CD5+CD19+CD24+CD27+ (D).
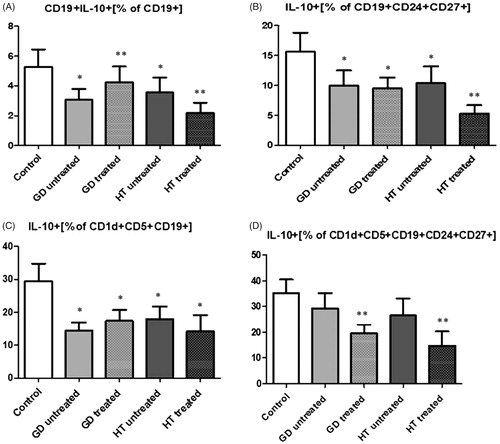
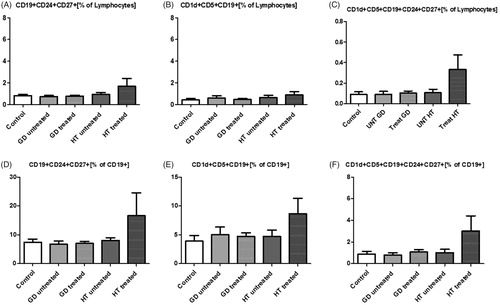
Figure 4. Changes in percentage of putative phenotypes of regulatory B cells within lymphocytes (row above) and CD19+ B cells (row below) in study groups: CD19+CD24+CD27+ (A, D), CD1d+CD5+CD19+ (B, E), CD1d+CD5+CD24+CD27+CD19+ (C, F).