Figures & data
Figure 1. Characterizationz of pSS patients. Patients (12 pSS and 11 control non-SS Sicca) were evaluated based on the ACR-EULAR criteria and saliva flow in control non-SS Sicca and pSS patients was evaluated. (A) indicates unstimulated, whereas stimulated saliva in non-SS-SICCA and pSS individuals is shown in (B). Error bars represent means ± SD, * indicates p < .05, respectively. C shows the quantification of the IgM RA factor between the non-SS-Sicca and pSS samples. * indicates a significant difference (p < .005). Description of non-SS-SICCA and pSS individuals along with histopathology and other parameters (including focus score, autoantibodies and histopathology) that were measured are provided in (D).
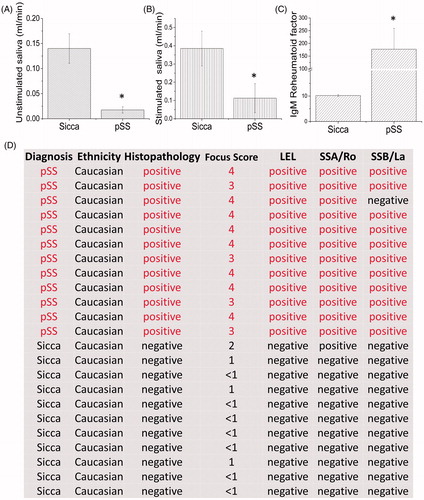
Figure 2. Differential expression of proteins in control and pSS samples. (A) 2D separation of individual proteins based on PI and molecular weight in non-SS SICCA and pSS samples (data shown is representation of six control non-Sicca and six pSS samples). Individual proteins were labelled using two different dyes (green was used to label non-SS-SICCA; whereas, red was used to label pSS) and differential expression of individual proteins was evaluated based on the colour difference on the 2 D-gel. Individual spots were quantification using DeCyder analysis (B) and decrease in the fold change of spot 1 and 2 were determined in C.
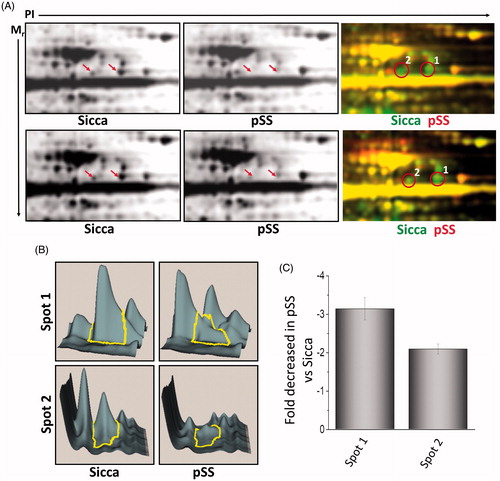
Figure 3. Alpha 1 antitrypsin expression is decreased in pSS samples as well as in the mouse model for Sjogren’s syndrome. 10uM sections were obtained from parotid glands and the expression of individual proteins was assessed. (A) Representative confocal images showing staining with alpha 1 antitrypsin and actin antibodies in control and pSS samples data obtained was from four control and six pSS minor or parotid salivary glands. Similarly, parotid glands of SS mouse model (IL14α) were also sectioned and expression (data shown is a representation from three control and three IL14αTg mice) of alpha 1 antitrypsin was evaluated and shown in (B). (C) Shows H&E staining in salivary gland from control and IL14α mice (images are representation of three individual samples performed in duplicate). Marker for apoptosis (Tunnel staining) and immune cells (CD11b and F4/80) was also used to evaluate cell death and immune infiltration in control and IL14α mice. (D) Total saliva was estimated for 20 min in control (8 female mice) and 10 age-matched female IL14αTg mice. Error bars represent means ± SD and * indicates p < .05.
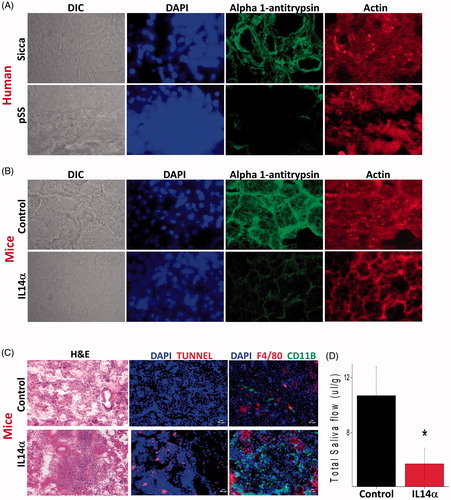
Table 1. Peptide information of the spots that were differentially expressed between control and pSS samples are shown in A.
Figure 4. Increased elastase expression in pSS samples as well as in IL14α mice. 10uM sections were obtained from submandibular glands and expression of leucocyte elastase was assessed in control and age-matched IL14α mice (A). Representative confocal images showing staining with elastase antibodies in control and pSS samples are shown in (B). Images shown are representation of three individual samples (three controls and three pSS or IL14-Τγ μιχε) περϕoρμεδ ιν δυπλιχατε.
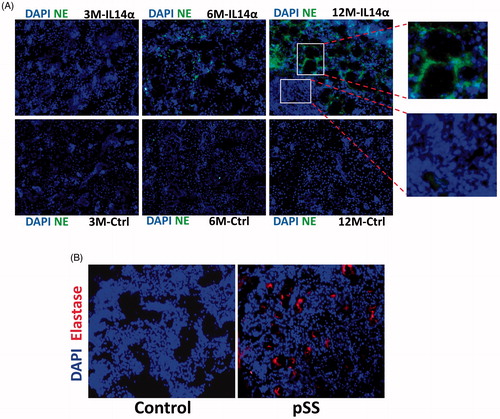
Figure 5. Expression of microRNAs that affect the serpin 1 gene. (A) illustrations showing various microRNA binding sites at the 3′ untranslated region of the serpina1 gene. Alterations in the expression of various microRNAs in the parotid tissues of pSS patints as compared with control non SS Sicca are shown as fold change in (B) Data presented are representation of three individual samples (three controls non SS Sicca and three pSS) performed in duplicate. (C) Shows relative quantification of miR132 in non-SS-Sicca and pSS samples. Error bars represent means ± SD and * indicates p < .05.
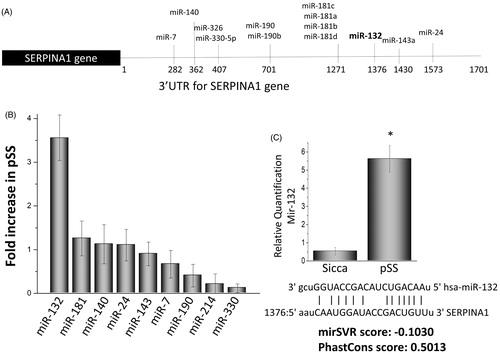
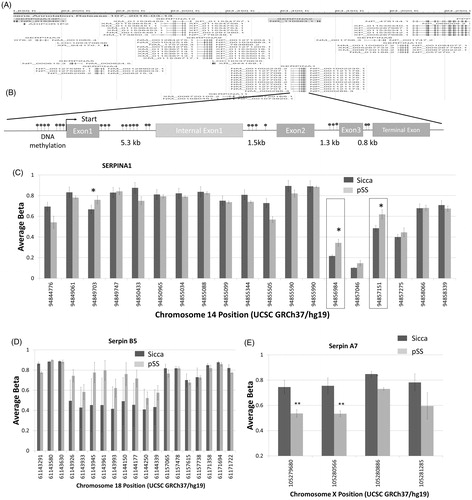
Figure 6. DNA methylations in the serpin gene. (A) Gene browser image showing the locus that clusters various serpin genes in humans. Model showing various DNA methylation sites as well as the exons/intron regions of serpina1 (B). Evaluation of all the DNA methylation sites on the serpina1 gene is shown as a bar graph in (C). Data presented are representation of samples from four controls non SS Sicca and four pSS samples performed in duplicate. Error bars represent means ± SD and * indicates p < .05. Evaluation of DNA methylation sites on the serpin B5 (D) and serpin A7 (E) gene are shown as bar graphs. Error bars represent means ± SD and * indicates p < .05.