
Figures & data
Table 1. Clinical characteristics of pSS patients included in the study.
Table 2. Clinical characteristics of non-SS sicca subjects included in the study.
Figure 1. NGAL expression in the acinar epithelium of salivary glands from patients with pSS. (A) NGAL (brown) is detected in acinar epithelium within the salivary glands of pSS patients. (B) A magnified representation of (A), where the arrowheads indicate NGAL staining of the acinar epithelium. (C) Little to no NGAL staining was observed in the non-SS subjects. (D) A magnified representation of (C). E) A quantification of NGAL staining within the salivary gland tissue reveals significantly greater NGAL expression in the acini of pSS patients as compared to non-SS sicca subjects (p < .0018). (F) Increase in degree of acinar NGAL staining with increasing focus score in patients with pSS. (G) Positive correlation between acinar NGAL staining and focus score in pSS patients (p < .02, r 2 = 0.54).
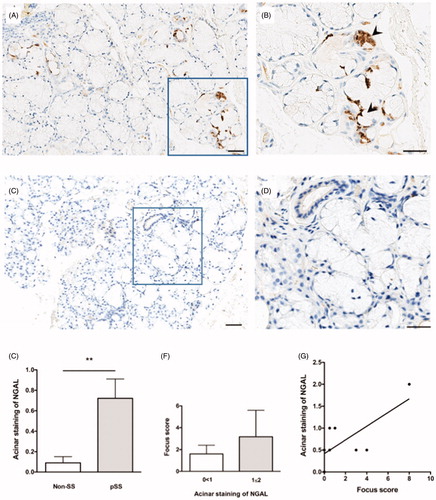
Figure 2. NGAL expression in the ductal epithelium of salivary glands from patients with pSS. (A) NGAL (brown) is detected in ductal epithelium within the salivary glands of pSS patients. (B) A magnified representation of (A), where the arrowheads indicate NGAL staining of the ductal epithelium. (C) A quantification of NGAL staining within the salivary gland tissue shows similar levels of NGAL expression in the ductal epithelium of pSS patients as compared to non-SS sicca subjects. (D) Decrease in degree of ductal NGAL staining with increasing focus score in patients with pSS. E) Negative correlation between ductal NGAL staining and focus score in pSS patients (p < .003, r 2 = −0.74).
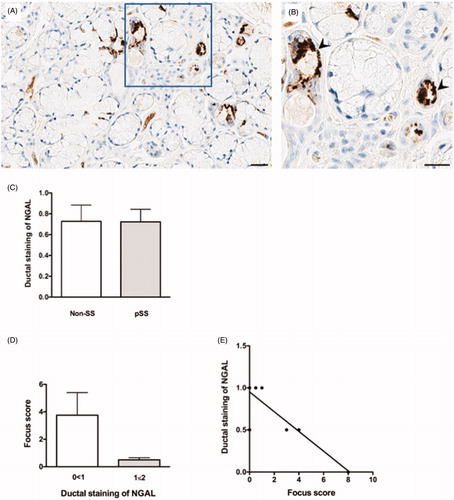
Figure 3. NGAL expression in the blood vessels of salivary glands from patients with pSS. Double immunohistochemical staining utilising NGAL (pink) and PNAd (green); for the detection of high endothelial venules, confirms NGAL expression in some of the blood vessels within the pSS target organ. The arrowheads indicate a double-positive blood vessel expressing both NGAL and PNAd.
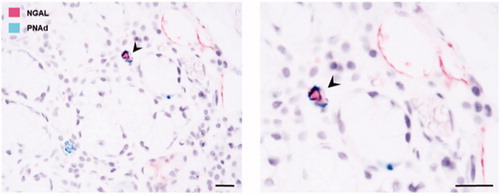
Figure 4. NGAL expression in relation to fatty infiltration. (A) NGAL (brown) is expressed in close proximity to adipose tissue in the salivary glands of pSS patients, where the arrowheads indicate areas of fatty infiltration. (B) A magnified representation of (A), where the arrowheads pinpoint NGAL stained areas in close proximity to the adipocytes. (C) Increase in NGAL acinar staining with increasing FI score in pSS subjects. (D) Increase in NGAL ductal staining with increasing FI score in patients with pSS.
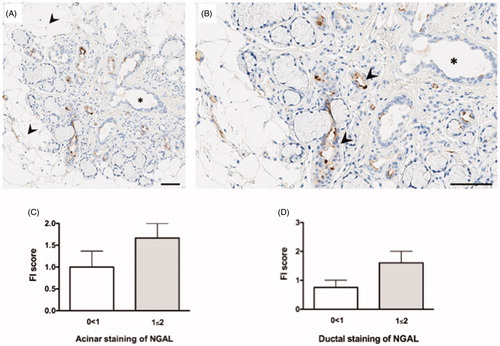
Figure 5. Expression of NGAL mRNA in salivary gland tissue using qRT-PCR. Enhanced NGAL mRNA expression is observed in the salivary glands of pSS patients, as compared to non-SS sicca subjects, with a 27.5% increase in the patient group (pSS 1.02, non-SS 0.82; p < .8). The mean of 2−(Δ Ct ) was calculated and presented in 10−4, where ΔCt = Ct (NGAL) – Ct (GAPDH).
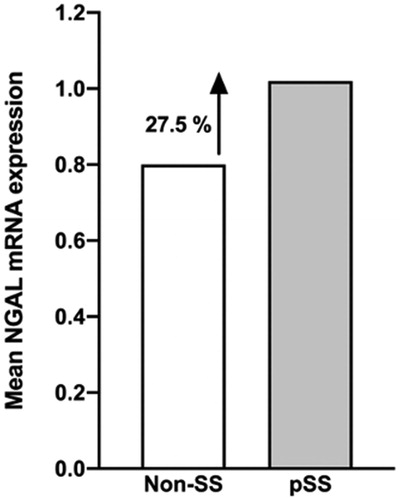
Figure 6. Detection and quantification of NGAL protein in the saliva of pSS patients through LC-MS analysis. A previous detection and quantification of proteins in stimulated whole saliva through LC-MS analysis [Citation26] revealed that NGAL protein is the most upregulated protein in saliva of pSS patients with the highest amount of proteins expressed, as compared to healthy controls. Illustrated above for the first time are the spectral counts measured in the saliva (purple) of each participant, representing NGAL abundance, where significantly greater amounts of NGAL protein are observed in the pSS patients.
![Figure 6. Detection and quantification of NGAL protein in the saliva of pSS patients through LC-MS analysis. A previous detection and quantification of proteins in stimulated whole saliva through LC-MS analysis [Citation26] revealed that NGAL protein is the most upregulated protein in saliva of pSS patients with the highest amount of proteins expressed, as compared to healthy controls. Illustrated above for the first time are the spectral counts measured in the saliva (purple) of each participant, representing NGAL abundance, where significantly greater amounts of NGAL protein are observed in the pSS patients.](/cms/asset/d9d572fa-4fa3-4d71-aceb-3fbf8e767424/iaut_a_1795140_f0006_c.jpg)