Figures & data
Figure 1. Sema4D expression levels in various human tumours. (A) Sema4D mRNA expression in human tumours and corresponding normal tissues based on TCGA database analysed by TIMER. (B) Sema4D protein expression levels in different types of human cancers compared with normal tissues based on the CPTAC database in UALCAN.
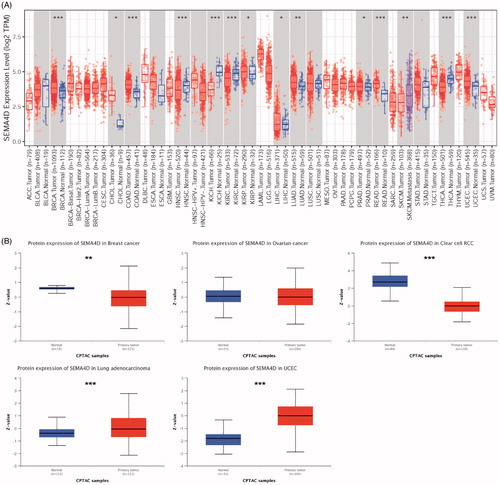
Figure 2. Kaplan-Meier survival curves of patients with the high and low Sema4D expression analysed by GEPIA. Overall survival (A) and disease free survival (B) in bladder cancer (BLCA), kidney clear cell renal cancer (KIRC), melanoma (SKCM), thymoma (THYM), and acute myeloid leukaemia (AML). 95% confidence interval information was added as dotted line. The hazards ratio (HR) was calculated based on Cox PH Model. Log-rank test was used to significance analysis.
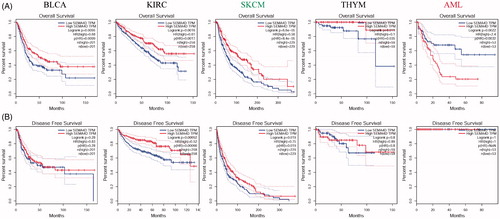
Figure 3. The differential expressed genes between high and low Sema4D expression in BLCA, KIRC, SKCM and THYM. Enrichment analysis of Gene ontology (GO) function and Kyoto encyclopaedia of genes and genomes (KEGG) pathway for differential expression genes. (A) Volcano map showed the differential expressed genes. Green means decrease, and red means increase. (B) GO and (C) KEGG pathway analysis in BLCA, KIRC, SKCM, and THYM. (D) Venn plots showed the intersection in differential expressed genes, GO and pathway categories between high and low Sema4D expression in BLCA, KIRC, SKCM, and THYM.
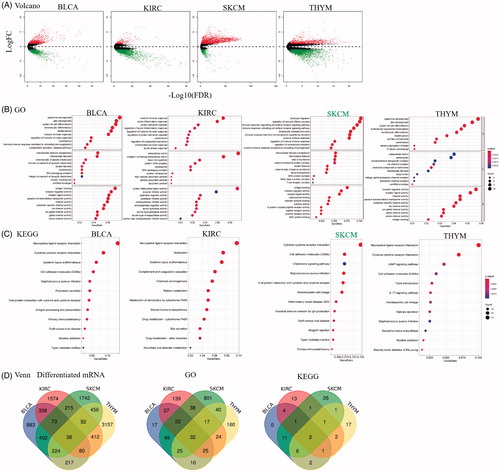
Figure 4. Correlation of Sema4D with immune infiltration level in BLCA, KIRC, SKCM, and THYM in TIMER database. (A) Sema4D expression is significantly positive correlated with the infiltration of B cells, neutrophils, and dendritic cells in BLCA. (B) Sema4D expression is significantly positive related to the infiltration of CD8+ T cells, CD4+ T cells, B cells, neutrophils, macrophages, and dendritic cells in KIRC. (C) Sema4D expression is significantly negative correlated with tumour purity, but positive correlated with the infiltrating level of CD8+ T cells, CD4+ T cells, B cells, neutrophils, and dendritic cells in SKCM, other than macrophages. (D) Sema4D expression is significantly positive related to the infiltration of CD8+ T cells, CD4+ T cells, B cells, neutrophils, and dendritic cells in THYM.
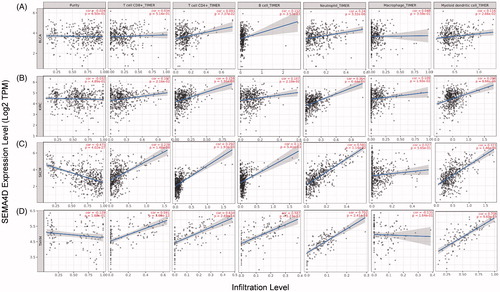
Figure 5. Correlation analysis between Sema4D and indicated genes or markers of immune cells in tumours and according normal tissues in GEPIA database. The strength of the correlation was determined using the following guide: −0–0 “negative correlation, blue,” 0–0.4 “weak correlation, orange,” 0.4–0.7 “moderate correlation, brown,” and 0.7–1 “strong correlation, red”. Pearson correlation coefficient was used. The non-log scale for calculation and use the log-scale axis for visualisation. Normal tissues contained TCGA normal tissues and GTEx data. *p < .05; **p < .01; ***p < .001.
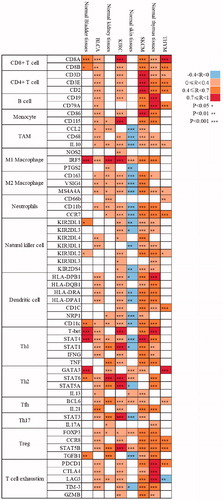
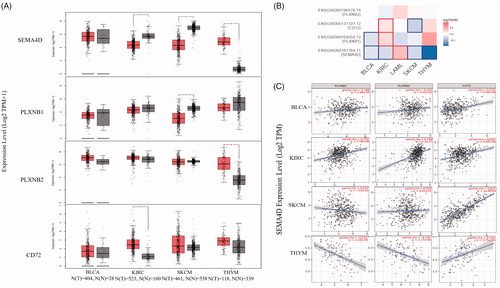
Figure 6. The expression, prognostic significance, and correlations of Sema4D and its receptors in diverse tumours. (A) the mRNA expression of Sema4D and its receptors PlexinB1, PlexinB2, and CD72 in BLCA (n = 404) comparing to the normal tissues (n = 28), in KIRC (n = 523) comparing to the normal tissues (n = 100), in SKCM (n = 461) comparing to the normal tissues (n = 558), and in THYM (n = 118) comparing to the normal tissues (n = 339) via GEPIA. *p < .01. (B) The overall survival significance map of Sema4D and its receptors in diverse tumours was analysed by GEPIA. The significant results were framed with blue line for negative correlation, and with red line for positive correlation. The filling colour from blue to red was used to show the hazards ratio (HR). (C) The correlation between the expression of Sema4D and its receptors in BLCA, KIRC, SKCM and THYM was calculated by TIMER.