
Figures & data
Figure 1. Binding of IgG1 and IgM to the surface of (A) splenic CD19+ B cells, (B) CD3+ T cells, and the different B cell subsets (C) CD19+CD21/35−CD23− age-associated B cells, (D) CD19+CD21/35loCD23+ follicular B cells and (E) CD19+CD21/35+CD23− marginal zone B cells in C57BL/6 (black circles) and NOD (white circles) mice. Obtained MFI was standardised as described in Materials and Methods. Neg = negative samples, i.e. autofluorescence. ** p < 0.01, *** p < 0.001, **** p < 0.0001.
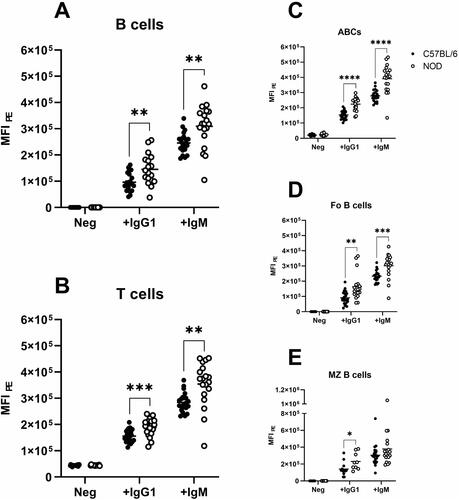
Figure 2. The surface binding partner that capture immunoglobulins was revealed by retagging. (A) Principle outline of the method applied. (B) Western blot analysis of fraction collected.
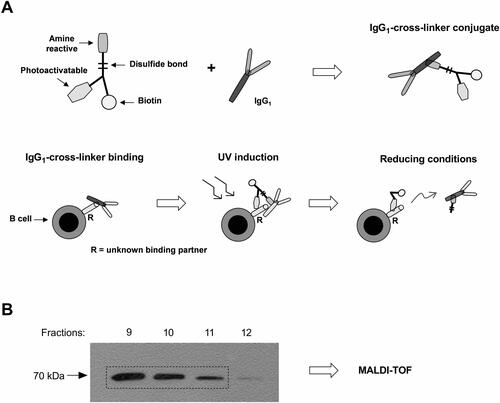
Figure 3. Levels of PE-conjugated isotype control and anti-HSC70 antibodies on the cell surface of splenic (A) B cells, (B) T cells, and the different B cell subsets (C) age-associated B cells, (D) follicular B cells and (E) marginal zone B cells in C57BL/6 (black circles) and NOD (white circles) mice. MFI was standardised as described in Materials and Methods. MFI = median fluorescence intensity for PE. ** p < 0.01, **** p < 0.0001.
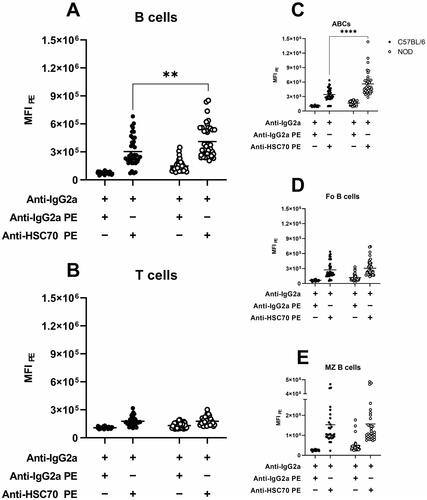
Figure 4. Binding of IgM to splenocytes after incubation with HSC70-binding substances. (A) IgM binding to CD19+ B cells or the CD19+CD21/35−CD23− ABC subset of C57BL/6 mice (black) or NOD (white) after incubation with only Fc block (circles) or with the addition of anti-HSC70 antibody clone 1B5 (squares) or anti-HSC70 antibody clone EP1531Y (triangles). (B) IgM binding to CD19+ B cells or the CD19+CD21/35−CD23− ABC subset of C57BL/6 mice (black) or NOD (white) after incubation with only Fc block (circles) or with the addition of scP155 (squares) or P155 (triangles). Statistical significance was calculated with unpaired t-test between strains, and with paired t-test within strains. *p < 0.05, **p < 0.01, ***p < 0.001 and ****p < 0.0001.
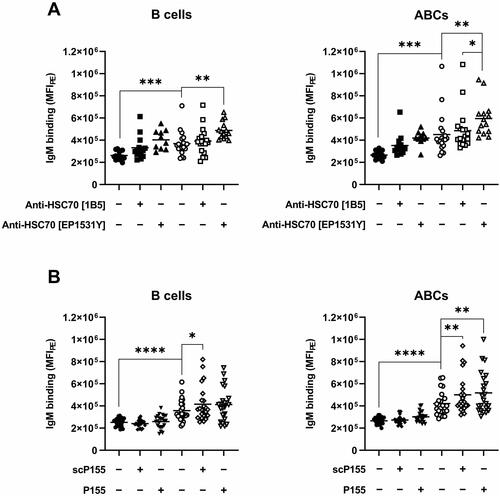
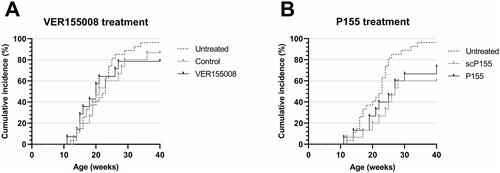
Figure 5. Cumulative incidence of diabetes in our untreated colony of female NOD mice (dashed line, n = 27) and (A) Female NOD mice treated with the HSC70 binding agent VER155008 (black solid line, n = 14) or vehicle solution (gray solid line, n = 15). (B) Female NOD mice treated with the HSC70 binding agent P155 (black solid line, n = 15) or scP155 (gray solid line, n = 15).
Data availability statement
No additional data set is associated with this paper.