
Figures & data
Figure. 1 Comparison of eight markers among RA group, non-RA group and healthy control group.
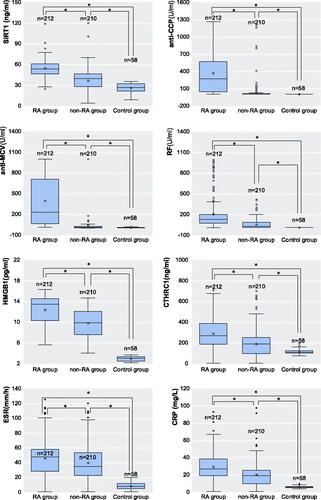
Table 1. General information of each group.
Figure 2. The ROC curves of the eight detection markers.
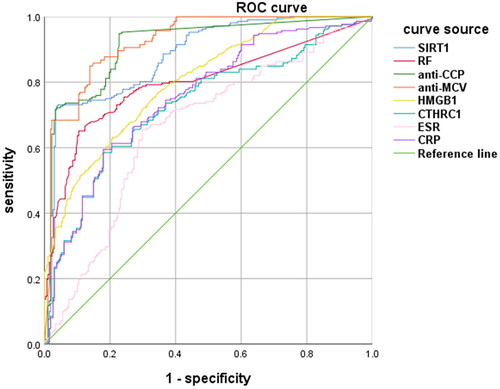
Table 2. Regions under the ROC curve of the eight test markers.
Table 3. Clinical evaluation of the eight test markers.
Table 4. Clinical evaluation of the combined test.
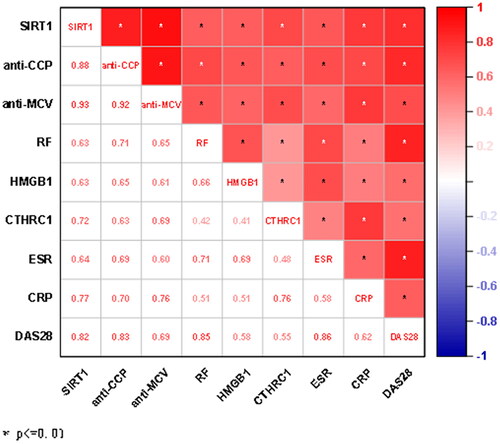
Figure 3. Degree of correlation between the markers.
Data availability statement
The data that support the findings of this study are available from the corresponding author, [LT], upon reasonable request.