
Figures & data
Table 1. The sequences of siRNAs targeting SUGT1 and miR-141-3p related RNA.
Table 2. The RT-qPCR forward and reverse primer sequences.
Figure 1. Lipopolysaccharide (LPS)-induced pyroptosis of FHC normal colon epithelial cells. A: Cell Counting Kit-8 was used to examine the effect of LPS on the proliferation of FHC cells. B: FCM was used to determine the effect of LPS on FHC cell apoptosis. C-E: ELISA was used to investigate the effect of LPS on the secretion of TNF-α, IL-1β, and IL-18 cytokines. F: The effect of LPS on cell morphology was observed under a light microscope. G: In the LPS-treated and untreated FHC cells, the expression of NLRP3, caspase-1, N-GSDMD, and key factors of pyroptosis was examined using WB. H: The expression of N-GSDMD was detected using FISH in the LPS-treated and untreated FHC cells. * p < 0.05, **p < 0.01, ***p < 0.01.
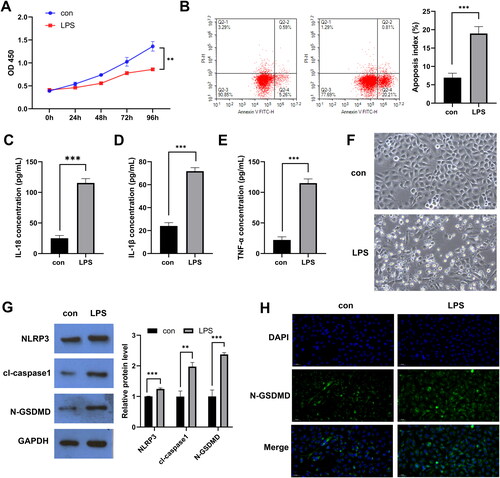
Figure 2. miR-141-3p inhibits lipopolysaccharide (LPS)-induced pyroptosis in FHC cells. A: RT-qPCR was used for the identification of miRNAs with down-regulated expression in mucosal tissues of patients with UC. B: qPCR analysis of miR-141-3p mimics/inhibitor effectiveness. C: Cell Counting Kit-8 was used to examine the effect of miR-141-3p increase or inhibition on LPS-induced FHC cell proliferation. D: FCM was used to investigate effect of miR-141-3p increase or inhibition on LPS-induced FHC cell apoptosis. E: ELISA was used to examine whether miR-141-3p increases or inhibits the secretion of IL-1β, IL-18 and TNF-α in LPS-induced FHC cells F: WB was used to examine whether miR-141-3p increases or inhibits the expression of the key apoptosis factors NLRP3, caspase-1, and N-GSDMD. G: FISH analysis of the effect of miR-141-3p on the expression of N-GSDMD. *p < 0.05, **p < 0.01, ***p < 0.01.
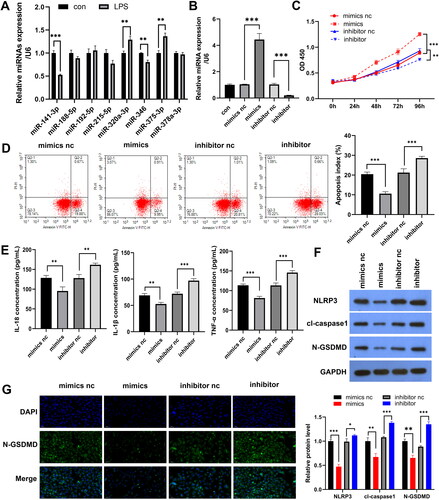
Figure 3. miR-141-3p targets SUGT1. A: Venn diagram showing the process of screening the target genes of miR-141-3p through prediction software and signalling pathways. B: RT-qPCR results showing the targeting efficiency of miR-141-3p against candidate target genes. C,D: qPCR and WB analysis of the targeting efficiency of miR-141-3p mimic and inhibitor against SUGT1. E: Schematic diagram of the 3’ UTR of miR-141-3p target SUGT1. F: Dual-luciferase experiments were performed to examine the binding efficiency of miR-141-3p to SUGT1 3′-UTR in 293 T cells. G: Dual-luciferase experiments were performed in FHC cells. H: WB analysis of the expression of SUGT1 in the lipopolysaccharide-induced and uninduced FHC cells. *p < 0.05, **p < 0.01, ***p < 0.01.
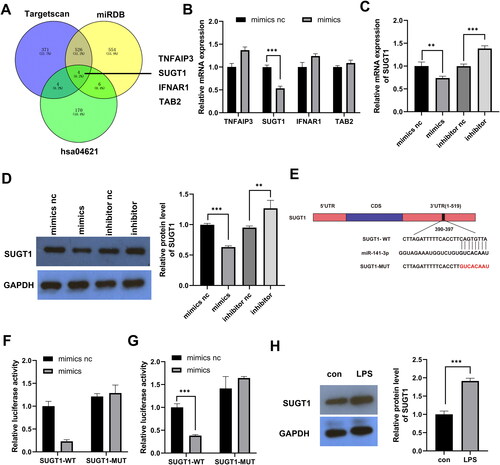
Figure 4. SUGT1 knockdown reverses the promoting effect of miR-141-3p inhibitor on lipopolysaccharide-induced FHC pyroptosis. A: RT-qPCR was used to determine the efficiency of siRNA-mediated knockdown of SUGT1. B: WB was used to determine the efficiency of siRNA-mediated knockdown of SUGT1. C: Cell Counting Kit-8 was used to examine whether SUGT1 knockdown can reverse the inhibitory effect of miR-141-3p inhibitor on LPS-stimulated epithelial cell model proliferation. D: FCM was used to examine whether SUGT1 knockdown reverses the effect of miR-141-3p inhibitor on the promotion of LPS-stimulated epithelial cell model apoptosis. E: Statistical Chart of Apoptosis. F: ELISA was used to examine the effect of SUGT1 knockdown on miR-141-3p inhibitor-promoted secretion of IL-1β, IL-18 and TNF-α in LPS-stimulated epithelial cell model. G: WB was used to investigate the effect of knockdown of SUGT1 on the expression of pyroptosis-related proteins in LPS-stimulated epithelial cell model, and the recovery effect of miR-141-3p inhibitor on the expression of these proteins. H: FISH was used to determine the effect of knockdown of SUGT1 on the expression of N-GSDMD protein in LPS-stimulated epithelial cell model, and the recovery effect of miR-141-3p inhibitor on the expression of N-GSDMD protein. *p < 0.05, **p < 0.01, ***p < 0.01.
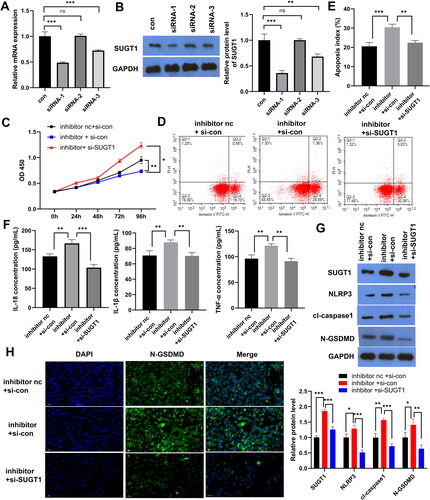
Figure 5. SUGT1 overexpression restores the inhibitory effect of miR-141-3p mimics on lipopolysaccharide-induced FHC pyroptosis. A: RT-qPCR was used to confirm SUGT1 overexpression. B: The overexpression of SUGT1 was detected using WB. C: The recovery effect of SUGT1 overexpression on miR-141-3p mimic-promoted LPS-stimulated epithelial cell model proliferation was determined using Cell Counting Kit-8. D: FCMwas used to examine the effect of SUGT1 overexpression on miR-141-3p mimic-mediated inhibition of LPS-stimulated epithelial cell model apoptosis. E: Statistical Chart of Apoptosis. F: ELISA was used to examine the inhibitory effect of SUGT1 overexpression on the inhibition of IL-1β, IL-18 and TNF-α secretion by miR-141-3p mimic in LPS-stimulated epithelial cell model. G: WB was used to determine the effect of overexpression of SUGT1 on the expression of pyroptosis-related proteins in LPS-stimulated epithelial cell model, and the recovery effect of miR-141-3p mimic on the expression of pyroptosis-related proteins. H: FISH was used to examine the effect of overexpression of SUGT1 on the expression of N-GSDMD protein in LPS-stimulated epithelial cell model, and the recovery effect of miR-141-3p mimic on N-GSDMD protein expression. *p < 0.05, **p < 0.01, ***p < 0.01.
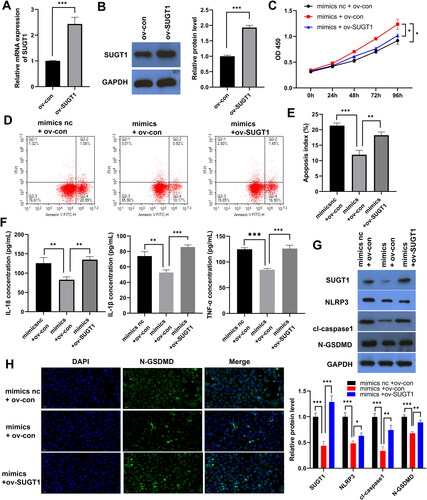
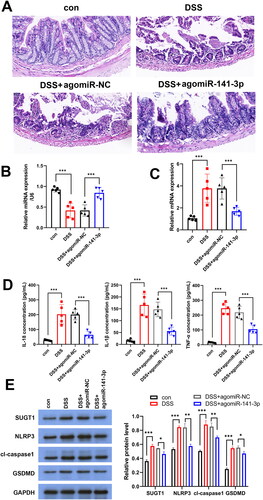
Figure 6. miR-141-3p alleviates DSS-induced ulcerative colitis in mice. A: HE staining was used to detect the protective effect of agomiR-141-3p on DSS-induced mouse intestinal epithelial tissue. B, C: RT-qPCR analysis the expression of miR-141-3p (B) and SUGT1 (C) in vivo. D: ELISA was used to determine the expression of IL-1β, IL-18 and TNF-α in serum of UC mice inject with agomiR-141-3p. *p < 0.05, **p < 0.01, ***p < 0.01.
Availability of data and materials
The data supporting the findings of this study are available from the corresponding author upon reasonable request.