
Figures & data
Figure 1. Effect of oHSV2 at different multiplicity of infection on the viability of DLBCL cells. (A) CCK-8 assay assessment of the effect of oHSV2 at various MOI on the viability of SU-DHL-4 and SU-DHL-6 cells at 0, 24, 48, and 72 h, two-way ANOVA. (B) Flow cytometry assessment of the apoptosis of SU-DHL-4 and SU-DHL-6 cells under oHSV2 or DOX treatment, one-way ANOVA and t-test. (C) Transwell assay assessment of the invasion ability of SU-DHL-4 and SU-DHL-6 cells under oHSV2 or DOX treatment, scale bar: 100 μm, one-way ANOVA and t-test. (D) EdU staining assessment of the proliferation ability of SU-DHL-4 and SU-DHL-6 cells under oHSV2 or DOX treatment, scale bar: 100 μm. Images were viewed using an inverted fluorescence microscope (#IX53, Olympus Corp, Tokyo, Japan) and captured by Image-ProPlus 5.1 Chinese. *p<.05, **p<.01, ***p<.001 vs control group. n = 3.
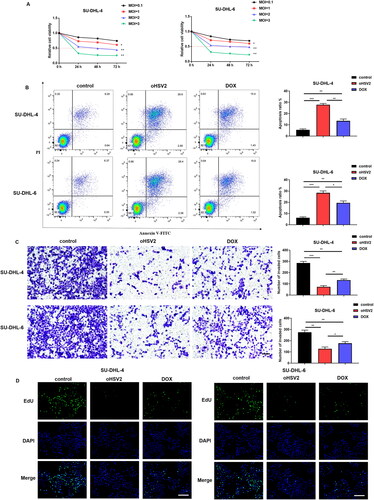
Figure 2. oHSV2 potently inhibits transplanted tumor growth and accelerates CD4 + T and CD8 + T cell infiltration in mice. (A) Representative images of DLBCL tumors after 42 days of oHSV2 or DOX treatment. (B) Volume changes of mouse tumors at days 0–42 after oHSV2 or DOX treatment, two-way ANOVA. (C) Immunohistochemistry assessment of the expression of antibodies against CD8 + T and CD4 + T cells in the tumor tissues of mice after oHSV2 or DOX treatment, CD8 and CD4 are both T cell membrane labeling, scale bar: 50 μm. (D) Flow cytometry assessment of the percentages of CD8 + T cells in the tumor tissues of mice after oHSV2 or DOX treatment, one-way ANOVA and t-test. (E) Flow cytometry assessment of the percentages of CD4 + T cells in the tumor tissues of mice after oHSV2 or DOX treatment, one-way ANOVA and t-test. *p<.05, **p<.01, ***p<.001 vs control group. n = 8.
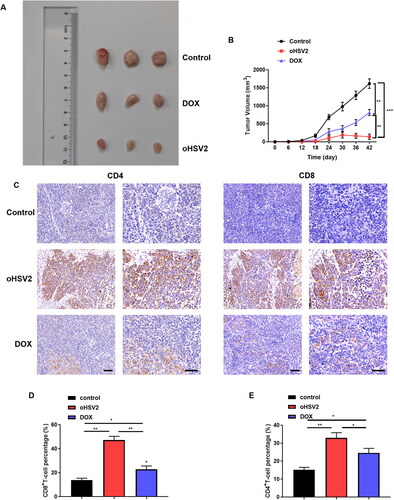
Figure 3. Safety of oHSV2 treatment in various organs of tumor bearing mice. (A) HE staining assessment of the pathological changes in the heart tissues of mice after oHSV2 or DOX treatment, Fibrosis area was calculated using a microscopic color image processing system (DpxView Pro, Korea), scale bar: 25 μm, one-way ANOVA and t-test. (B) HE staining assessment of the pathological changes in the kidney tissues of mice after oHSV2 or DOX treatment, the Suzuki score was used to quantify the pathological changes of liver tissue in terms of congestion, vacuolar degeneration, necrosis and the degree of injury, scale bar: 25 μm, one-way ANOVA and t-test. (C) HE staining assessment of the pathological changes in the liver tissues of mice after oHSV2 or DOX treatment, the volume of glomeruli in renal tissue was calculated and quantified by a microscopic color image processing system, scale bar: 25 μm, one-way ANOVA and t-test. (D) ELISA assessment of the levels of CK-MB and cTnI in the serum of mice after oHSV2 or DOX treatment, one-way ANOVA and t-test. (E) Automatic biochemical analyzer detection of the levels of ALT and AST in the serum of mice after oHSV2 or DOX treatment, one-way ANOVA and t-test. (F) Automatic biochemical analyzer detection of the level of BUN and CREA in the serum of mice after oHSV2 or DOX treatment, one-way ANOVA and t-test. ns p>.05, *p<.05, **p<.01, ***p<.001. n = 8.
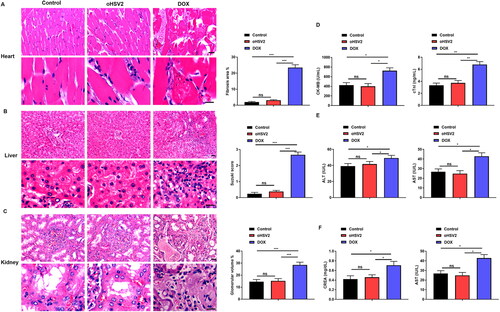
Figure 4. oHSV2 can inhibit the PD-1/PD-L1 immune-checkpoint. (A) Immunohistochemical evaluation of PD-L1-positive rate in tumor tissues of mice after oHSV2 or DOX treatment, scale bar: 50 μm, n = 8. (B) RT-qPCR evaluation of PD-L1 mRNA level in tumor tissues of mice after oHSV2 or DOX treatment, non-paired t-test, n = 8. (C) Western blotting evaluation of PD-L1 protein level in tumor tissues of mice after oHSV2 or DOX treatment, n = 8. (D) Flow cytometry assessment of the percentages of PD-L + T cells in the tumor tissues of mice after oHSV2 or DOX treatment, non-paired t-test, n = 8. (E) The PD-L1 expression profile across all tumor samples and paired normal tissues (dot plot), each dots represent expression of samples. (F) Based on GEPIA database, the expression of PD-L1 in in tissues from 47 DLBCL tumor patients and 337 normal tissues, non-paired t-test. (G) Western blotting evaluation of PD-L1 protein level in SU-DHL-4 cells after oHSV2 or DOX treatment, one-way ANOVA and t-test, n = 3. (H) Western blotting evaluation of PD-L1 protein level in SU-DHL-6 cells after oHSV2 or DOX treatment, one-way ANOVA and t-test, n = 3. nsp>.05, **p<.01, ***p<.001. n = 6.
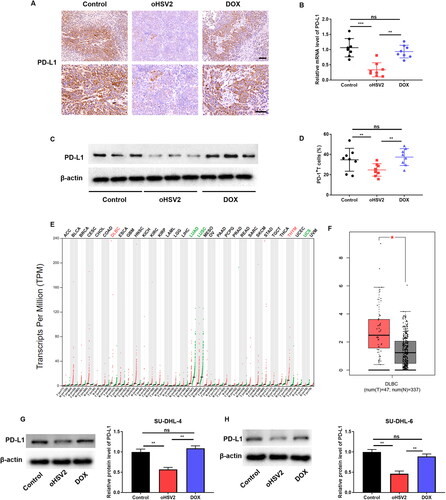
Figure 5. oHSV2 restrains cytotoxic T lymphocyte (CTL) apoptosis and encourages cell proliferation by inhibiting the PD-1/PD-L1 immune-checkpoint on DLBCL cells. (A) LDH cytotoxicity kit evaluation of cytotoxicity of CD8+ T cells after co-culture of CD8 + T and SU-DHL-4 cells under oHSV2 or DOX treatment, one-way ANOVA and t-test. (B) CFSE staining assay evaluation of CD8+ T cell proliferation after co-culture of CD8 + T and SU-DHL-4 cells under oHSV2 or DOX treatment. (C) Flow cytometry evaluation of CD8+ T cell apoptosis after co-culture of CD8 + T and SU-DHL-4 cells under oHSV2 or DOX treatment, one-way ANOVA and t-test. *p<.05, **p<.01 vs control group. n = 3.
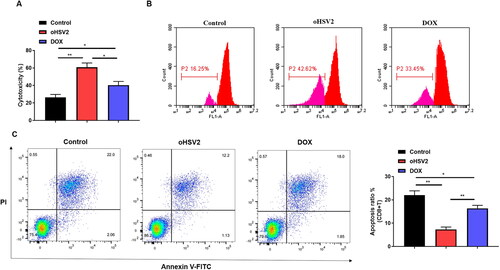
Figure 6. Effect of oHSV2 in combination with PD-1/PD-L1 immune-checkpoint inhibitors on DLBCL cell behavior. (A) Western blotting assessment of the PD-L1 protein level in SU-DHL-4 cells under oHSV2 or/and PD-L1 antibodies treatment, one-way ANOVA and t-test. (B) Flow cytometry assessment of the apoptosis ability of SU-DHL-4 cells under oHSV2 or/and PD-L1 antibodies treatment, one-way ANOVA and t-test. (C) Transwell assessment of the invasion ability of SU-DHL-4 cells under oHSV2 or/and PD-L1 antibodies treatment, scale bar: 100 μm, one-way ANOVA and t-test. (D) EdU staining assessment of the proliferation ability of SU-DHL-4 cells under oHSV2 or/and PD-L1 antibodies treatment, scale bar: 100 μm. *p<.05, **p<.01, ***p<.001 vs control group. #p<.05, ##p<.01 vs oHSV2 or PD-L1 group. n = 3.
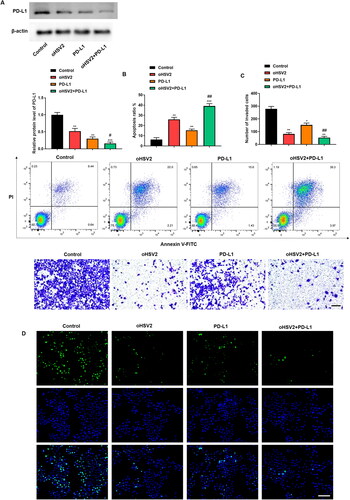
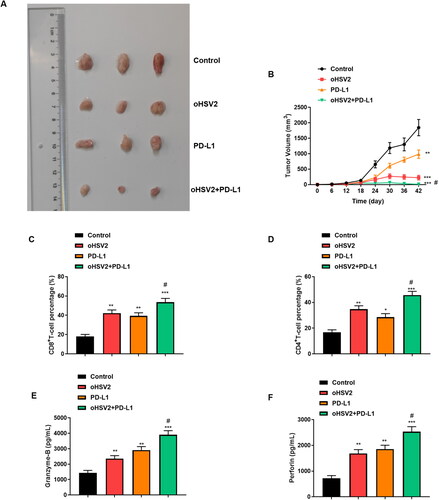
Figure 7. Combination of oHSV2 and PD-L1 conspicuously inhibited transplanted tumor growth in mice. (A) Representative images of DLBCL tumors after 42 days of oHSV2 or/and PD-L1 antibody treatment. (B) Volume changes of mouse tumors at days 0–42 after oHSV2 or/and PD-L1 antibody treatment, two-way ANOVA. (C) Flow cytometry assessment of the percentages of CD8 + T cells in the tumor tissues of mice after oHSV2 or/and PD-L1 antibody treatment, one-way ANOVA and t-test. (D) Flow cytometry assessment of the percentages of CD4 + T cells in the tumor tissues of mice after oHSV2 or/and PD-L1 antibody treatment, one-way ANOVA and t-test. (E) ELISA assessment of the contents of Granzyme-B in the serum of mice after oHSV2 or/and PD-L1 antibody treatment, one-way ANOVA and t-test. (F) ELISA assessment of the contents of Perforin in the serum of mice after oHSV2 or/and PD-L1 antibody treatment, one-way ANOVA and t-test. *p<.05, **p<.01, ***p<.001 vs control group. #p<.05 vs oHSV2 or PD-L1 group. n = 8.
Supplemental Material
Download MS Word (15.4 KB)Data availability statement
The datasets used during the present study are available from the corresponding author upon reasonable request.