
Figures & data
Table 1. Characteristics of the healthy donors enrolled in the study.
Figure 1. Enumeration of SARS-CoV-2 spike-specific CD4+ Th1, CD8+ CTL and CD4+ CD25high Treg and their memory phenotype in 22 healthy vaccinated subjects. (A) PBMC were separated from 22 vaccinated subjects and stimulated in vitro with the SARS-CoV-2 spike peptides pool. Twenty-four hours after stimulation cells were collected and stained with specific monoclonal antibodies to determine their activation state (AIM assay). First gating on CD3+ T cells (anti-CD3-AF700, clone OKT3, mouse IgG2aκ, BioLegend), CD4+ Th1 were studied with anti-CD4-BV605 (clone RPA-T4, mouse IgG1κ, BD Biosciences), anti-4-1BB-allophycocyanin (clone 4B4-1, mouse IgG1κ, BioLegend), and anti-OX40-PE/Cy7 (clone Ber-ACT35, mouse IgG1κ, BioLegend). The percentage of AIM + CD4+ Th1 cells from un-stimulated control and SARS-CoV-2 CD4 S-all-stimulated cells were compared by the Wilcoxon matched-pairs signed rank test. CD8+ CTL were studied with anti-CD8-PE/CF594 (clone RPA-T8, mouse IgG1κ, BD Biosciences), anti-4-1BB-allophycocyanin (clone 4B4-1, mouse IgG1κ, BioLegend), and anti-CD69-PE (clone FN50, mouse IgG1κ, BD Biosciences). The percentage of AIM + CD8+ CTL from unstimulated control and CD4+ Th1 SARS-CoV-2 spike stimulated cells were compared by the Wilcoxon matched-pairs signed rank test. Regulatory T cells (Treg) were defined as CD4+ CD25high (anti-CD4-BV605, clone RPA-T4, mouse IgG1κ, BD Biosciences, and anti-CD25-BV421, clone M-A251, mouse IgG1κ, BD Biosciences). The percentage of CD4+ CD25high Treg from unstimulated control and SARS-CoV-2 spike-stimulated cells were compared by the Wilcoxon matched- pairs signed rank test. CCR6 expression on CD4 + Th1, CD8 + CTL and Treg was determined by staining with anti-CCR6-PerCp/Cy5.5 (clone 11A9, mouse IgG1κ, BD Biosciences). CCR6 expression was found in a large percentage of SARS-CoV-2-spike-specific CD4+ Th1 cells (median: 34.35%) and CD4+ CD25high Treg (median: 27.50%) in most subjects, unless CD8+ CTL where CCR6 was found in a much lower percentage (median: 11.66%). (B) T cell Memory phenotypes. Anti-CD45RA-APC-H7 (clone HI100, mouse IgG2bκ, BD Biosciences), and anti-CCR7- FITC (clone G043H7, mouse IgG2aκ, BioLegend) were used to determine memory populations on gated AIM + CD4+ Th1 and CD8+ CTL and Treg. Each dot shows the percentage of memory populations: terminally differentiated effector T cells (CD45RA + CCR7- TEMRA), median 2.66% on CD4+ Th1; median 44.75% on CD8+ CTL; and median 1.77% on Treg), effector memory T cells (CD45RA- CCR7- TEM), median 62.1% on CD4+ Th1, median 27.75% on CD8+ CTL, median 58.45% on Treg, and central memory T cells (CD45RA- CCR7+ TCM, median) 29.15% on CD4+ Th1, median 4.41% on CD8+ CTL, and median 22.70% on Treg).
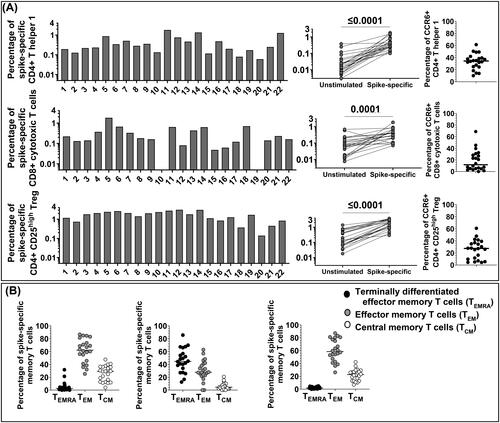
Figure 2. Phenotype of SARS-CoV-2 spike-specific Treg. SARS-CoV-2 spike-specific Treg lines were generated from donor #14 and expanded in vitro from bulk cultures for phenotypical characterizion to determine their ontogeny, possibly reverting from pro-inflammatory T cells (pTreg) or arising from naïve T cells primed in tissues that synthetize spike proteins. (A) We used intracellular staining to detect FOXP3 (anti-FOXP3 PE, clone 259D, mouse IgG1k, Biolegend), and surface CTLA-4 (anti-CTLA-4 PE/Dazzle594, clone BNI3, mouse IgG2ak, Biolegend), PD-1 (anti-PD-1 BV605, clone EH12.2H7, mouse IgG1k, Biolegend), IL7Ra (anti-IL7Ra FITC, eBioRDR5, mouse IgG1k, eBioscience) and CD45RA (anti-CD45RA APC, clone HI100, mouse Ig2bk, eBioscience) on gated CD4+ CD25high Treg. CTLA-4 and PD-1 were measurable on Treg with minor differences between Treg lines. IL-7R and CD45RA were not expressed on SARS-CoV-2-specific Treg suggesting that Treg were not reverting from pro-inflammatory T cells repeatedly stimulated, but they differentiate from a naïve T cell repertoire. (B) To address the role of IL-2 in determining CTLA-4 and PD-1 expression on SARS-CoV-2 spike-specific Treg, we FACS sorted Treg from donor #1 after 72 h in vitro priming with spike peptides, prior to re-stimulation with agonistic antibodies to CD3 and CD28. FACS-sorted Treg were cultured with different regimens of IL-2 for 48 h prior to staining with specific monoclonal antibodies. The results suggested that Treg were pure, FOXP3 positive, and that the expression of Treg markers, CTLA-4 and PD-1 increased depending upon the amount of IL-2 in culture.

Figure 3. TEM and TCM Treg develop early on during vaccination with little changes after further vaccine boosts. The SARS-CoV-2 spike-specific memory Treg repertoire has been explored consecutively, months apart, in donors # 1 and #11 studied after the second and third injection, respectively, and #6 that received four vaccine administration and has been studied seven months apart. Numerous TEM and TCM Treg were found in circulation after two vaccine injection in two subjects, #1 and 11, left and middle panels, with little changes after the third dose. Donor 6, studied at two time points after the fourth dose, showed a comparable development of Treg memory as the other two subjects studied after two vaccine injections (right panel).
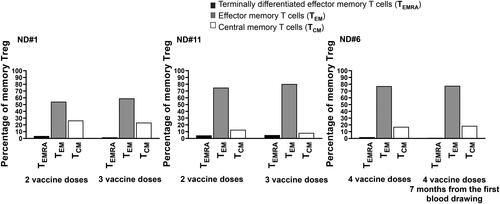
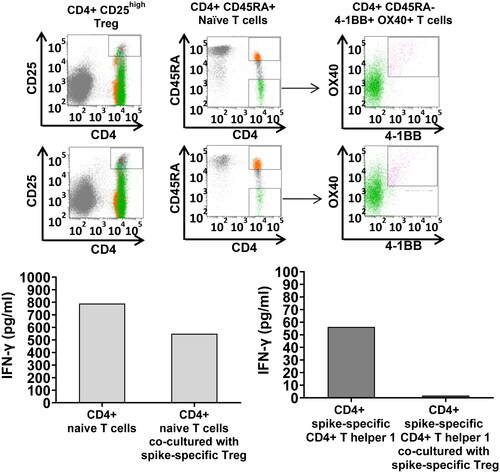
Figure 4. Treg-mediated down-regulation of IFNγ production by naïve T cells and AIM + T cells in co-culture. SARS-CoV-2 spike-specific Treg, naïve CD4+ T cells, AIM + CD4+ Th1 have been FACS-sorted by flow cytometry with specific monoclonal antibodies after in vitro priming with the spike mega pool (FACS sorting strategy shown in the upper panel) and co-cultured either with autologous CD4+ naïve T cells (left panels) or SARS-CoV-2 spike-specific CD4+ Th1 (right panels) at 1:1 T cell ratio (25,000 T cells in the naïve T cell/Treg co-cultures and 1,000 T cells in the AIM+/Treg co-cultures). IFNγ secretion, measured in culture supernatants by ELISA, served as a read out in these experiments. The results indicated that Treg down-regulate both, naïve T cell polarization toward a pro-inflammatory phenotype, and IFNγ secretion by the AIM + T cells.
Supplemental Material
Download MS Word (1.3 MB)Data availability statement
The authors confirm that the data supporting the findings of this study are available within the article.