
Figures & data
Figure 1. Identification and analysis of DEARGs in the GSE30999 dataset. (A) PCA for GSE30999. (B) Volcano plot of the DEGs. (C) Venn diagram of the DEARGs in DEGs and ARGs. (D) The PPI network of the DEARGs, green and red, represent downregulated and upregulated genes, respectively. (E) Heatmaps of the DEARGs in the GSE30999 dataset.
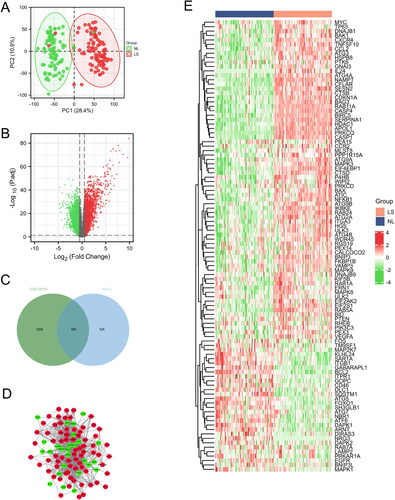
Figure 2. Functional analysis of the DEARGs.
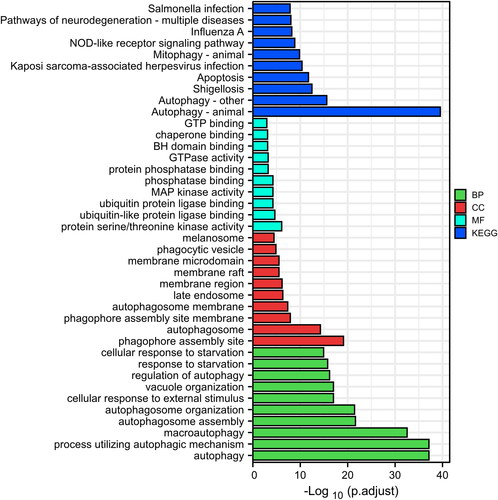
Figure 3. Identification of core DEARGs. (A) PPI network of DEARGs. Top 10 genes with the Highest betweenness (B), closeness (C), and degree (D). (E) Venn diagram of the overlapped genes. (F) Heatmaps of the 10 core DEARGs in the GSE30999 dataset.
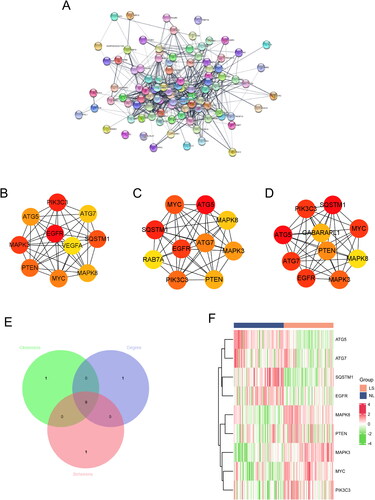
Figure 4. Function analysis of the 10 core DEARGs. (A) GO-BP enrichment analysis. (B) KEGG enrichment analysis.
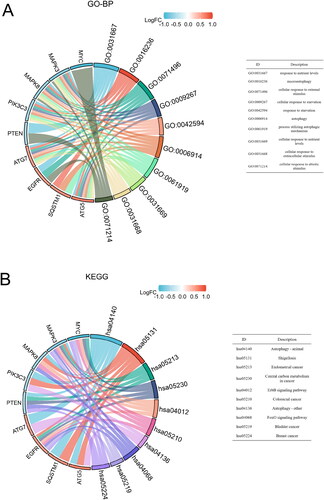
Figure 5. Validation of core genes. (A) Heatmaps of the 10 core DEARGs in the GSE41662 dataset. (B) mRNA expression of 10 core genes in the GSE41662 dataset.
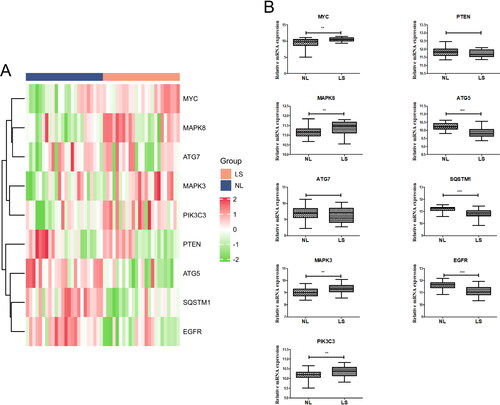
Figure 6. Receiver operating characteristic (ROC) analysis of core genes.
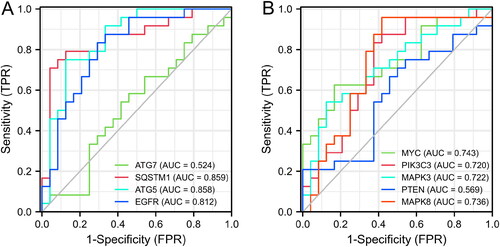
Figure 7. Correlation analysis of the 10 core DEARGs.
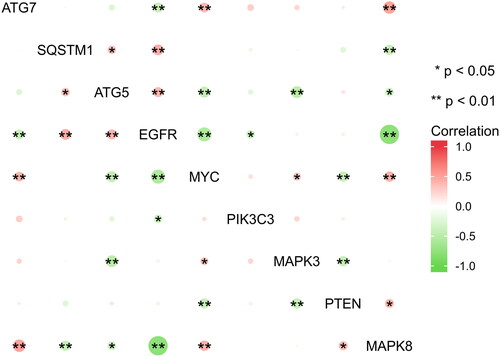
Figure 8. Levels of immune cell fractions between NL and LS samples.
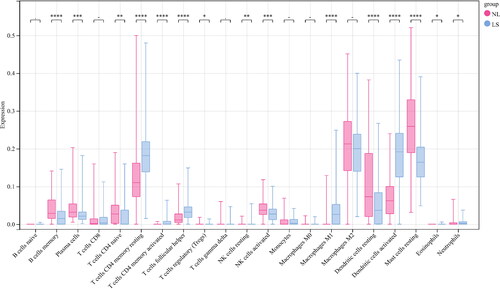
Figure 9. Correlation analysis between core genes and immune cells. (A) Correlation between immune cells and ATG5. (B) Correlation between immune cells and EGFR. (C) Correlation between immune cells and MAPK3. (D) Correlation between immune cells and MAPK8.
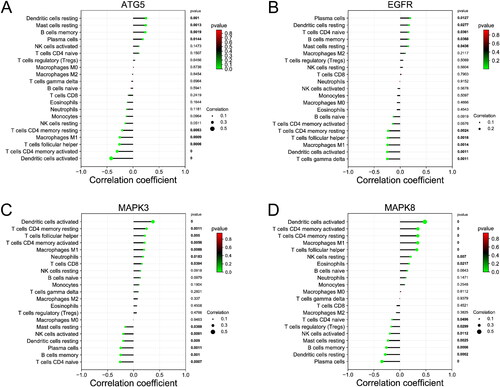
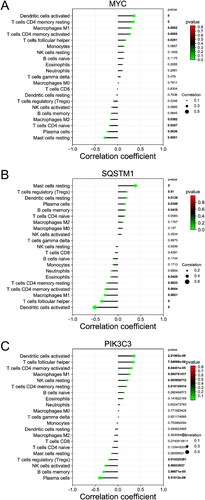
Figure 10. Correlation analysis between core genes and immune cells. (A) Correlation between immune cells and MYC. (B) Correlation between immune cells and SQSTM1. (C) Correlation between immune cells and PIK3C3.
Supplemental Material
Download MS Word (20.3 KB)Data availability statement
Analysis data in the present study can be obtained from the corresponding author upon reasonable request. The datasets used in our study are available from the GEO database (https://www.ncbi.nlm.nih.gov/).