
Figures & data
Table 1. The clinical characteristics of patients with RSA or normal controls.
Figure 1. KISS-1 was down-regulated in RSA. The KISS-1 levels in the villus tissue of the RSA patients were assessed via RT-qPCR (a), immunohistochemistry (C) and western blotting (D) assays. (B) ROC curves of KISS-1 in RSA. **p < 0.01.
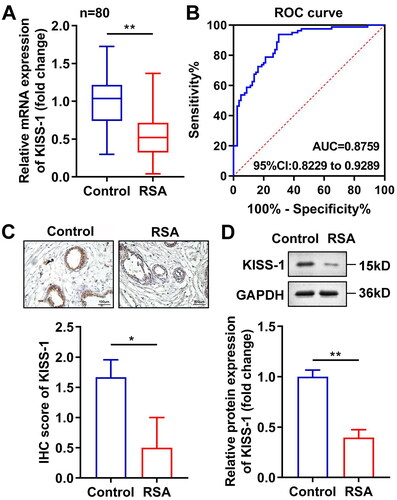
Figure 2. KISS-1 overexpression inhibited the cell growth of HTR8/Svneo cells. The transfection efficiency of oe-KISS-1 was determined via RT-qPCR (A) and western blotting (B) assays. (C) After oe-KISS-1 transfection, the cell viability was tested with a CCK-8 assay. (D) Images of cloned, migrated, and invaded cells. Quantification of cloned (E), migrated (F), and invaded (G) cells. (H) The protein levels of ZO-1 and ZEB1 were calculated via western blotting. **p < 0.01.
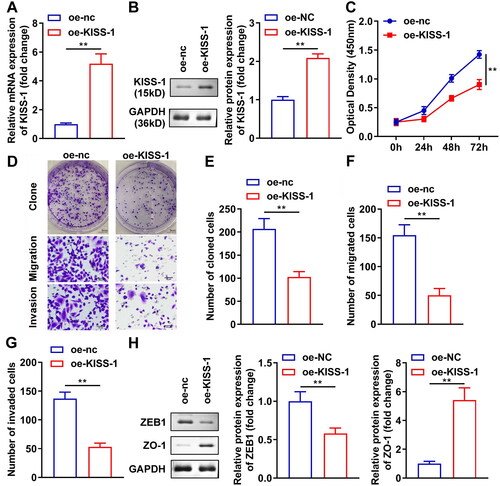
Figure 3. GPR54 silencing neutralized the roles of oe-KISS-1 in HTR8/Svneo cells. The transfection efficiency of sh-GPR54 was determined via RT-qPCR (A) and western blotting (B) assays. (C) After oe-KISS-1 and sh-GPR-54 transfection, the cell viability was tested with a CCK-8 assay. (D) Images of cloned, migrated, and invaded cells. Quantification of cloned (E), migrated (F), and invaded (G) cells. (H) The protein levels of ZO-1 and ZEB1 were calculated via western blotting. **p < 0.01.
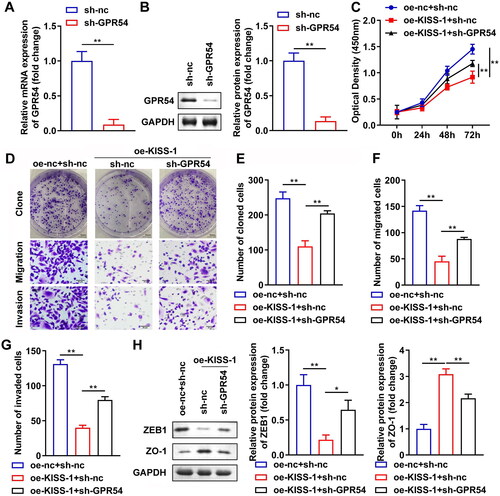
Figure 4. KISS-1 modulated the PI3K/AKT signaling pathway by targeting GPR54. (A) The levels of PI3K and AKT were assessed via western blotting. (B) The mRNA levels of GPR54 in the villus tissue of the RSA patients were detected via RT-qPCR assay. (C, D) The protein levels of GPR54, p-PI3K, and p-AKT in the villus tissue of the RSA patients were detected via western blotting. **p < 0.01.
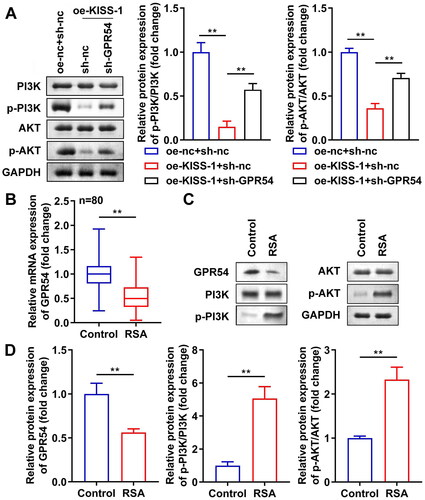
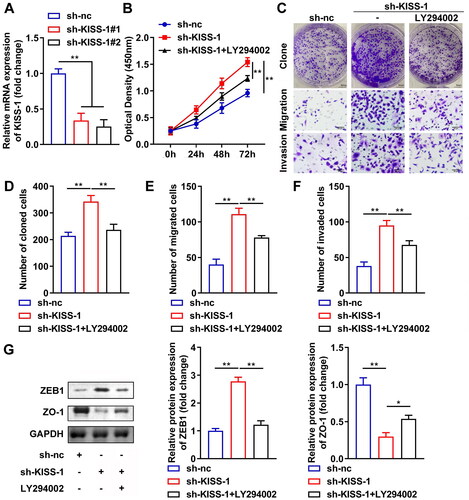
Figure 5. Inhibition of the PI3K/AKT signaling pathway suppressed the growth of the sh-KISS-1-treated HTR8/Svneo cells. (A) The transfection efficiency of sh-GPR54 was determined via RT-qPCR. (B) After sh-KISS-1 and LY294002 treatment, the cell viability was tested with a CCK-8 assay. (C) Images of cloned, migrated, and invaded cells. Quantification of cloned (D), migrated (E), and invaded (F) cells. (G) The protein levels of ZO-1 and ZEB1 were calculated via western blotting. *p < 0.05, **p < 0.01.
Data availability statement
The datasets used and/or analyzed during the current study are available from the corresponding author on reasonable request.