
Figures & data
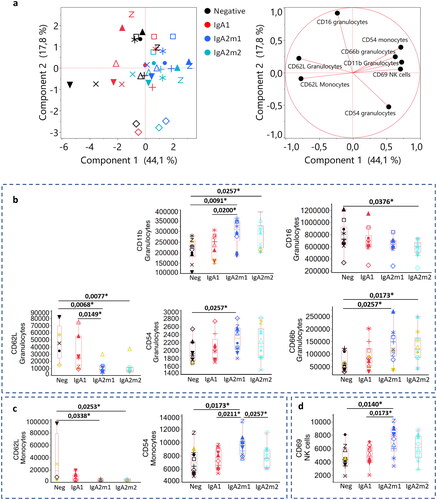
Figure 1. IgA subclasses show different activation profiles upon whole blood incubation. (a) Principal component analysis after selection of most discriminative parameters identified in Figure S3. (b) Box plots of the best discriminants for granulocytes (b), monocytes (c) and NK cells (d). Each shape represents a different donor (n = 10). Triplicate MFI average are represented excluding the conditions in which we obtained CVs > 30%. Triplicates with CVs between 20 and 30% are represented in yellow. Statistical significance was determined by a nonparametric Wilcoxon test with multiple comparisons, with *p < 0.05.
Supplemental material
Supplemental Material
Download MS Word (6.8 MB)Data availability statement
Raw data can be shared upon reasonable request.