
Figures & data
Table 1. Location and salinity of the major North Sea ports (AAPA World Port Rankings Citation2010).
Figure 1. An overview of the North Sea bathymetry, northwestern Europe (from ICONA Citation1992). The dark dots are the major North Sea ports. The numbers correspond to the numbers in Table 1.
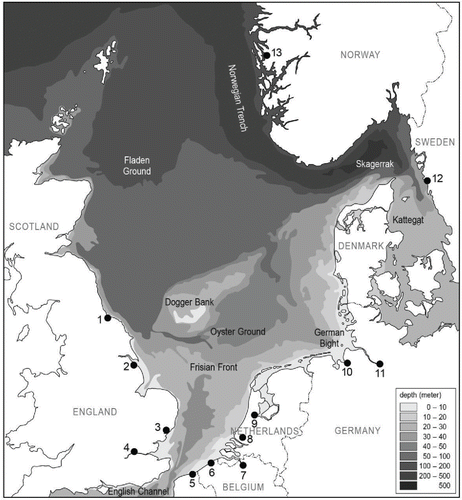
Table 2. Sailing times in hours between the major ports in the North Sea, based on a speed-over-ground of 10 knots.
Figure 2. The salinity of the North Sea during August (from Van Aaken Citation1990). The numbered dots with lines show the boundary of the salinity (psu). The dark dots are the major North Sea ports. The numbers correspond to the numbers in Table 1.
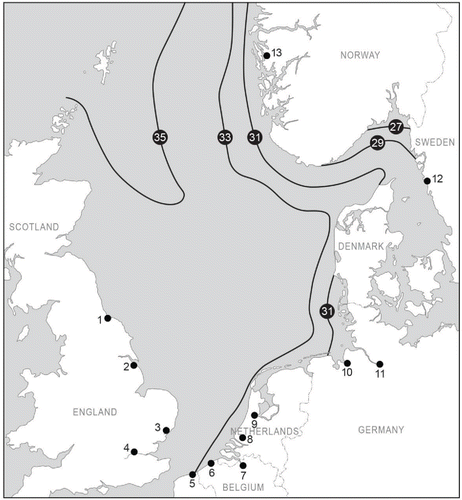
Figure 3. Attitude of ship companies toward ballast water management (BWM) exemptions in the North Sea area (NS). Thirteen companies responded to the questionnaire; twelve of these companies have ships that frequently take in ballast water (Appendix A). BW, ballast water; BWMC, Ballast Water Management Convention.
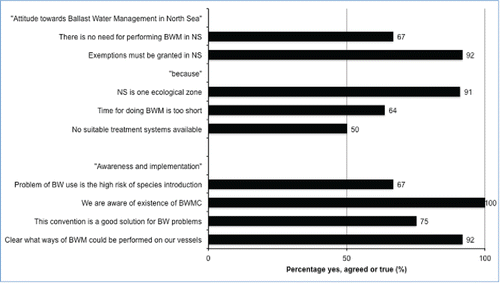
Figure 4. The counterclockwise residual current in the North Sea (black) and the deep water flow from the Atlantic Ocean (gray) (Turrell Citation1992). The arrow width indicates the magnitude of volume transport. The dark dots are the major North Sea ports. The numbers correspond to the numbers in Table 1.
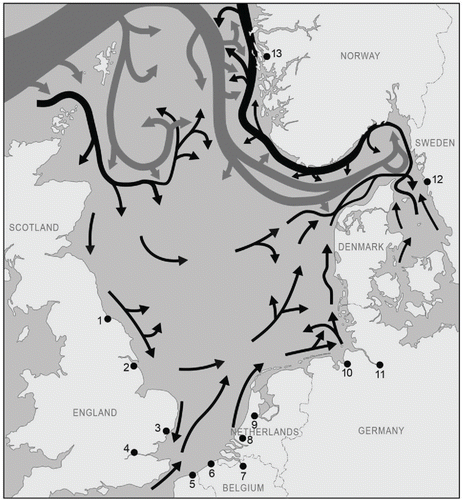
Figure 5. The different benthic habitats in the North Sea. The benthic habitats are determined by the bathymetry, the residual current (see and ), and the sediment particle size of the North Sea (Eisma 1991; Paramor et al. Citation2009). The habitats are checked vis-à-vis the distribution patterns of different benthic organisms (Rees et al. Citation2007; ICES Citation2008). The variation in gray scale indicates the proposed benthic zones. The dark dots are the major North Sea ports. The numbers correspond to the numbers in Table 1.
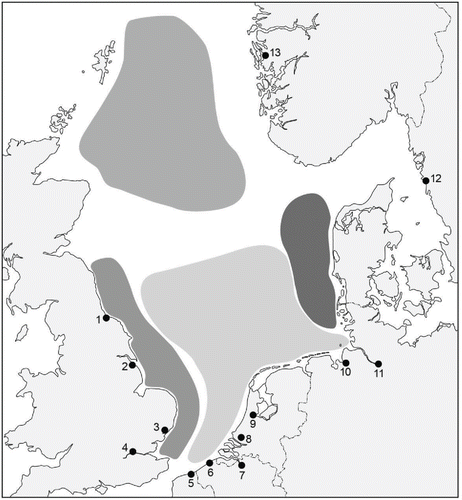
Figure 6. Major shipping links of the Global Network of Shipping projected on the North Sea area (from ESA Citation2009). Line thickness indicates the shipping density between the different nodes of the network. The dark dots are the major North Sea ports. The numbers correspond to the numbers in Table 1.
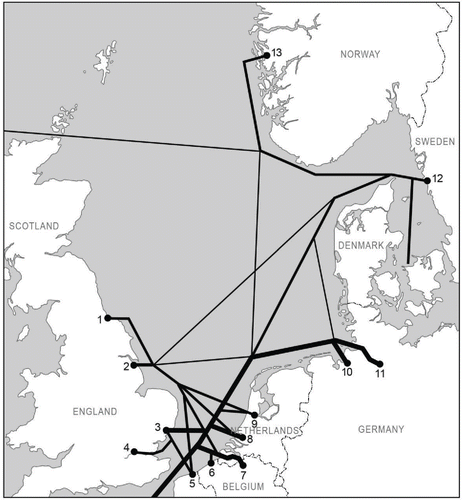
Table 3. The range of water salinities in which various groups of organisms are able to survive and to establish (Boesch Citation1977).
Appendix A. Overview of the result of the questionnaire on ballast water use and management.