
Figures & data
Figure 1. Representative amplification curves for Alu-115 and Alu-247. An arbitrary cut-off value of ΔRn = 0.65 was used to obtain the Ct values. Ct115 and Ct247 mean Ct values of Alu-115 and Alu-247, respectively.
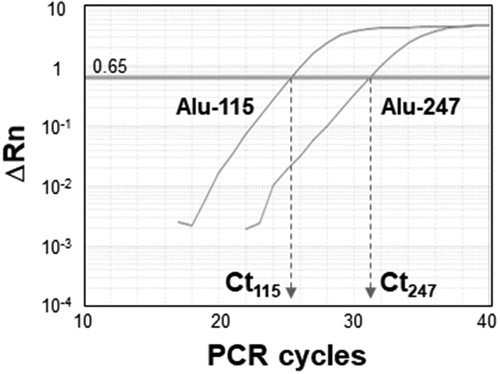
Figure 2. Total cfDNA (Alu-115) (A), tumor cell-derived cfDNA (Alu-247) (B), and the cfDNA integrity (Alu-247/Alu-115) (C) of pre- and post-first cycle vaccination are shown (n = 130).
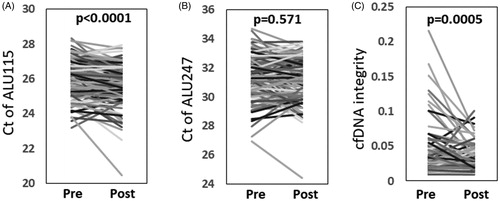
Figure 3. The patients (n = 130) were divided into high and low groups of cfDNA integrity of pre-vaccination (A), post-first cycle vaccination (B), or the difference in cfDNA integrity between pre- and post-first cycle vaccination (Δ cfDNA integrity) (C) and the overall survival were analyzed by the Kaplan–Meier plot. P-values show the results of the Cox hazard model.
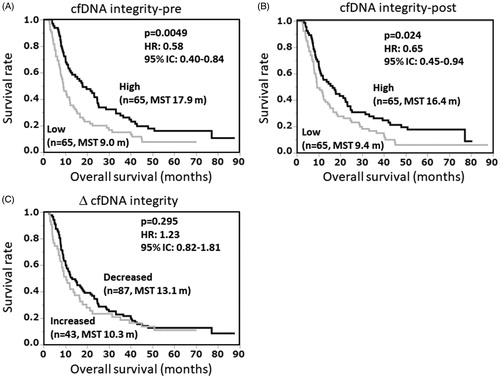
Figure 4. Distribution of the numbers of IgG and/or CTL response augmented (positive) peptides of the 58 patients.
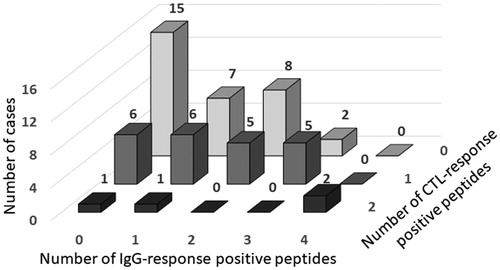
Figure 5. Relationship between cfDNA integrity and vaccine-induced IgG response (n = 130). Pre- (A, E) and post- (B, F) vaccination cfDNA integrity, and the alterations in the cfDNA integrity (Δ cfDNA integrity) (C, G) of the IgG response-positive and -negative groups (A-C) or of the subgroups of IgG response-positive peptides (E–G) are shown. (D) Percentages of cfDNA integrity-decreased cases in the IgG response-positive and -negative groups are shown. The differences among the IgG response-positive and -negative groups or subgroups in pre- and post-vaccination cfDNA integrity, Δ cfDNA integrity, or the percentages of cfDNA integrity-decreased cases were analyzed using the nonparametric Wilcoxon test.
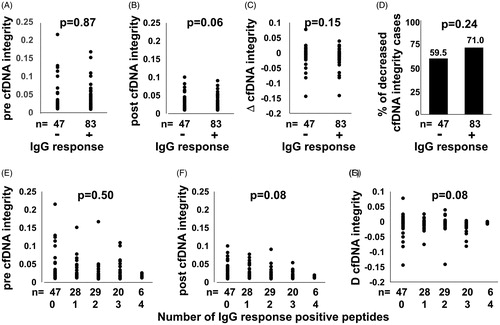
Figure 6. Relationship between cfDNA integrity and vaccine-induced CTL response (n = 58). Pre- (A, E) and post- (B, F) vaccination cfDNA integrity, and the alterations of cfDNA integrity (Δ cfDNA integrity) (C, G) of the CTL response-positive and -negative groups (A–C) or of the subgroups of the number of CTL response-positive peptides (E–G) are shown. (D) Percentages of cfDNA integrity-decreased cases in the CTL response-positive and -negative groups are shown. The difference among the CTL response-positive and -negative groups or subgroups in pre- and post-vaccination cfDNA integrity, Δ cfDNA integrity, or the percentages of cfDNA integrity-decreased cases were analyzed using the nonparametric Wilcoxon test.
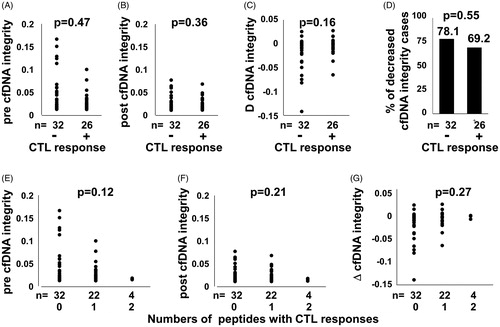
Table 1. Relationship between cfDNA integrity and vaccine-induced immune responses.
Data availability statement
The datasets used and/or analyzed during the current study are available from the corresponding author on reasonable request.