Figures & data
Figure 1. Experimental layout of protective effects of endotoxin tolerance on peripheral lipopolysaccharide-induced dopaminergic neuronal injury.
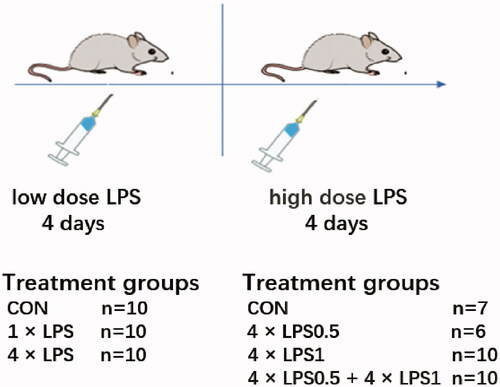
Figure 2. Repeated low-dose intraperitoneal LPS injection-induced ET. The expression of TNF-α and IL-1β was suppressed, while that of IL-10 was increased by repeated 0.5 mg/kg intraperitoneal LPS injection. (a) The levels of TNF-α, IL-1β, and IL-10 in the SN were detected by ELISA. (b) The expression of TNF-α, IL-1β, and IL-10 in the SN were detected by qRT-PCR. Data are presented as mean ± SEM (n = 3 mice per group). Statistical significance was determined by ANOVA with post hoc LSD tests; *p < .05, **p < .01 versus control group, #p < .05 versus 1 × LPS group.
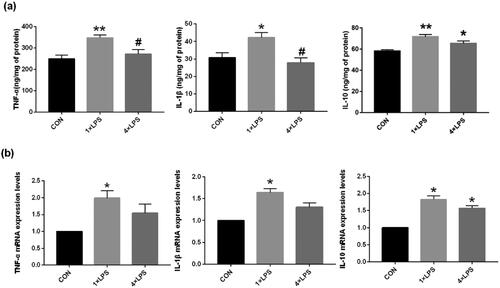
Figure 3. ET preconditioning inhibited neuroinflammation induced by continuous high dose LPS injection. (a) The levels of TNF-α, IL-1β, and IL-10 in the SN were detected by ELISA. (b) The levels of TNF-α, IL-1β, and IL-10 in the SN were detected by qRT-PCR. Data are presented as the mean ± SEM (n = 3 mice per group). Statistical significance was determined by ANOVA with post hoc LSD tests or Dunnett's T3 tests; *p < .05, **p < .01 versus control group, #p < .05, ##p < .01 versus 4 × LPS1 group.
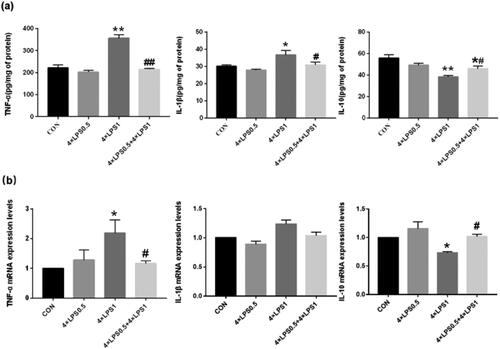
Figure 4. The protein expression of Iba-1 and CD68 was detected in the SN by western blotting. β-actin protein was used as an internal control. Bar graphs represent the relative expression of Iba1 and CD68 (n = 3 mice per group). (a) Relative expression level of Iba-1. (b) Relative expression level of CD68; Statistical significance was determined by ANOVA with post hoc LSD tests; *p < .05, versus control group, ##p < .01 versus 4 × LPS1 group.
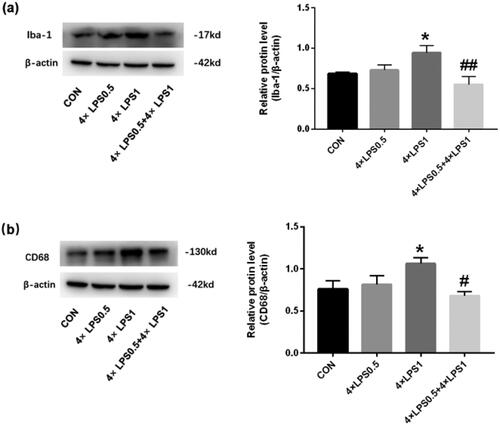
Figure 5. CD68 and Iba-1 double positive cells were examined by immunofluorescence with quantitative analysis using Image Pro Plus. red: CD68 (a marker of activation of microglia); green: Iba-1(a marker of microglia). The microscopy images were taken with 200 μm of magnification and the squares represent the approximation to 100 μm. (a) control group (b) 4 × LPS0.5 group (c) 4 × LPS1 group (d) 4 × LPS0.5 + 4 × LPS1 group (e) Quantitative results. Data are presented as the mean ± SEM (n = 3 mice per group). Statistical significance was determined by ANOVA with post hoc LSD tests; **p < .01 versus control group, ##p < .01 versus 4 × LPS1 group.
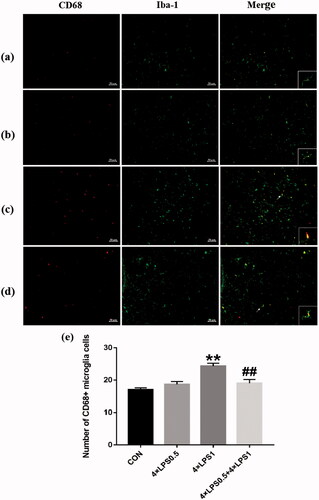
Figure 6. Determination of TH and DA in the SN. Data are presented as the mean ± SEM (n = 3 mice per group). (a) TH protein expression was examined by western blotting. (b) TH gene expression was examined by qRT-PCR. (c) DA protein expression was examined by ELISA; Statistical significance was determined by ANOVA with post hoc LSD tests; **p < .01, versus control group, #p < .05, ##p < .01, versus 4 × LPS1 group.
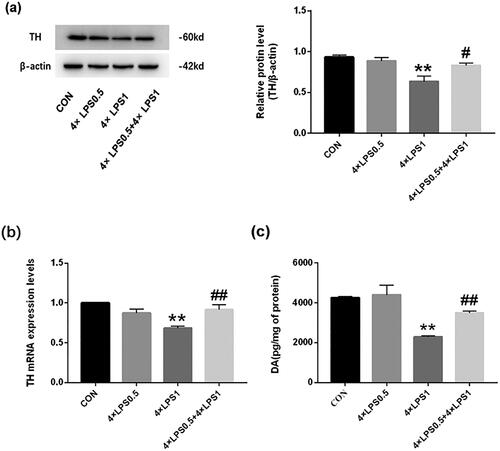
Figure 7. Effect of ET on LPS-induced neuronal morphological alterations in the SN. Sections were stained with HE (magnification 400×, scale bar: 20 μm).
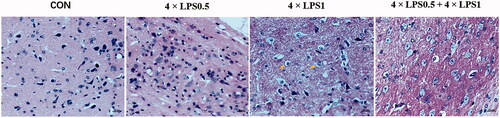
Figure 8. ET inhibited high doses of LPS-induced dopaminergic neuronal death. immunofluorescence double staining of SN for TH and Iba-1. red - TH; green -Iba-1 (n = 3 per group). The ipsilateral sides are shown. The microscopy images were taken with 200 μm of magnification and the squares represent the approximation to 100 μm. (a) control group (b) 4 × LPS0.5 group (c) 4 × LPS1 group (d) 4 × LPS0.5 + 4 × LPS1 group (e) Representative quantification of TH. Values represent mean ± SD. Statistical significance was determined by ANOVA with post hoc LSD tests, *p < .05, **p < .01 versus control group; ##p < .01 versus 4 × LPS1 group.
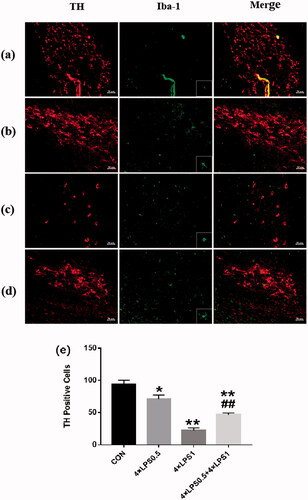
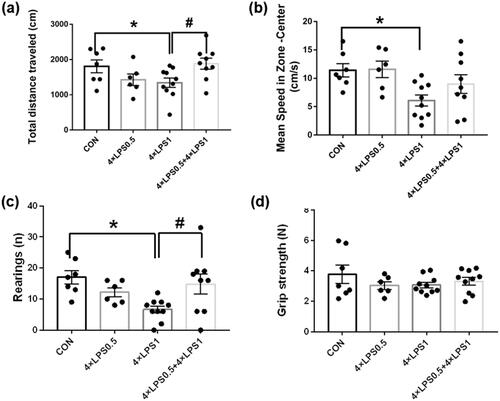
Figure 9. Continuous peripheral high doses of LPS reduced movement in mice. There was no significant change in muscle tension. ET preconditioning can alleviate movement disorders. (a) Total distance traveled in the open field zone. (b) mean speed in zone-center (cm/s). (c) Number of rearing. (d) Grip strength. Data are presented as the mean ± SEM of 6–10 mice per group; Statistical significance was determined by ANOVA with post hoc LSD tests; *p < .05, versus control group, #p < .05, versus 4 × LPS1 group.