Publication Cover
Biofouling
The Journal of Bioadhesion and Biofilm Research
Volume 27, 2011 - Issue 10
4,600
Views
99
CrossRef citations to date
0
Altmetric
Original Articles

Review – Interactions between diatoms and stainless steel: focus on biofouling and biocorrosion

, &
Pages 1105-1124 | Received 12 Apr 2011, Accepted 28 Sep 2011, Published online: 04 Nov 2011

Figures & data

Table 1. The main diatom species identified on stainless steel surface after immersion in natural waters at different locations.

Figure 1. SEM images of diatom fouling of SS surfaces after exposure in natural river (Oise, France), showing the presence of (A) Cocconeis and (B) Cymbella sp.
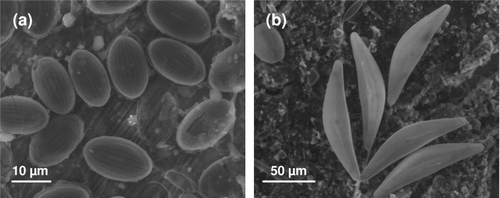
Figure 1. SEM images of diatom fouling of SS surfaces after exposure in natural river (Oise, France), showing the presence of (A) Cocconeis and (B) Cymbella sp.

Figure 2. Micrograph of Amphora sp., showing the presence of EPS on a solid surface. This organism has two raphes (one is visible) both of which are on the ventral surface.
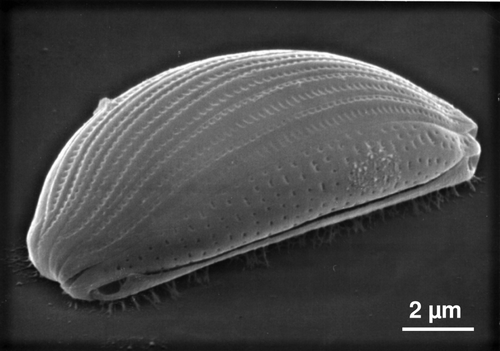
Figure 2. Micrograph of Amphora sp., showing the presence of EPS on a solid surface. This organism has two raphes (one is visible) both of which are on the ventral surface.

Figure 3. AFM deflection images recorded in aqueous solution for the fusiform (A–C), triradiate (D–F) and ovoid (G–I) morphotypes of Phaeodactylum tricornutum. Labels V, G and S correspond to the following features: valve, girdle region and streaks. The features highlighted by the asterisks in (H) reflect tip convolution artifacts. Reproduced with permission from Francius et al. (2008a).
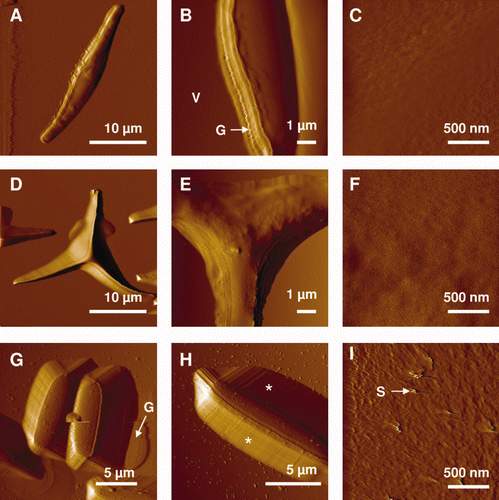
Figure 3. AFM deflection images recorded in aqueous solution for the fusiform (A–C), triradiate (D–F) and ovoid (G–I) morphotypes of Phaeodactylum tricornutum. Labels V, G and S correspond to the following features: valve, girdle region and streaks. The features highlighted by the asterisks in (H) reflect tip convolution artifacts. Reproduced with permission from Francius et al. (2008a).

Figure 4. Mechanical properties of the ovoid girdle (G)/valve (V) interface of Phaeodactylum tricornutum diatom. (A) Deflection image (dashed line indicates the interface); (B) elasticity maps (z-range = 1000 kPa) corresponding to the inset image in (A); (C) typical force-indentation curve; (D) distribution of elasticity values (n = 1024 force curves). Reproduced with permission from Francius et al. (2008a).
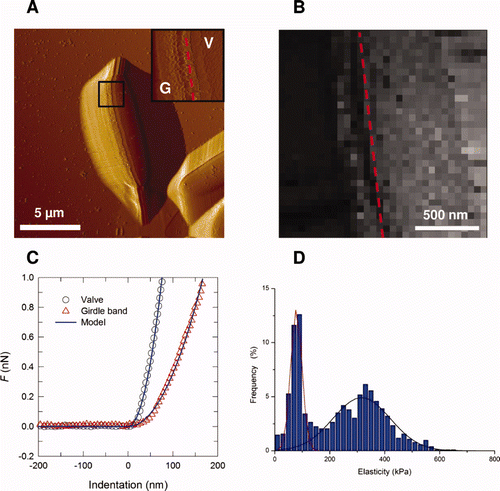
Figure 4. Mechanical properties of the ovoid girdle (G)/valve (V) interface of Phaeodactylum tricornutum diatom. (A) Deflection image (dashed line indicates the interface); (B) elasticity maps (z-range = 1000 kPa) corresponding to the inset image in (A); (C) typical force-indentation curve; (D) distribution of elasticity values (n = 1024 force curves). Reproduced with permission from Francius et al. (2008a).

Figure 5. Cell probe experiments (A and B). (A) SEM micrograph of a single diatom cell attached with epoxy glue to an AFM tipless cantilever; (B) representative force vs distance curves obtained with bioprobe diatoms in the stationary phase on Intersleek (a–c) and mica (d–f) surfaces. The work of detachment, W, is given in fJ units (10−15 J) for each curve. The arrow represents the approach and retraction directions. Reproduced with permission from Arce et al. (Citation2004). Nanoscale structure and hydrophobicity of Aspergillus fumigatus. (C) Deflection image and (D) adhesion force map obtained with a hydrophobic tip on SDS-treated conidia, revealing highly correlated structural and hydrophobic heterogeneities. Reproduced with permission from Dague et al. (Citation2007). Detecting individual galactose-rich polysaccharides on LGG bacteria (E and F). (E) AFM deflection image of single LGG bacteria trapped into porous polymer membrane and adhesion force map (inset, gray scale: 200 pN) and (F) representative force curves recorded with PA–1 tip on LGG wild-type. Reproduced and adapted with permission from Francius et al. (Citation2008b).
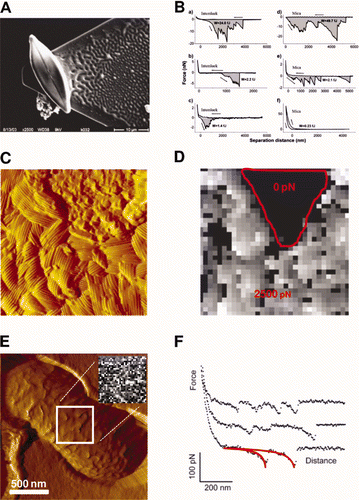
Figure 5. Cell probe experiments (A and B). (A) SEM micrograph of a single diatom cell attached with epoxy glue to an AFM tipless cantilever; (B) representative force vs distance curves obtained with bioprobe diatoms in the stationary phase on Intersleek (a–c) and mica (d–f) surfaces. The work of detachment, W, is given in fJ units (10−15 J) for each curve. The arrow represents the approach and retraction directions. Reproduced with permission from Arce et al. (Citation2004). Nanoscale structure and hydrophobicity of Aspergillus fumigatus. (C) Deflection image and (D) adhesion force map obtained with a hydrophobic tip on SDS-treated conidia, revealing highly correlated structural and hydrophobic heterogeneities. Reproduced with permission from Dague et al. (Citation2007). Detecting individual galactose-rich polysaccharides on LGG bacteria (E and F). (E) AFM deflection image of single LGG bacteria trapped into porous polymer membrane and adhesion force map (inset, gray scale: 200 pN) and (F) representative force curves recorded with PA–1 tip on LGG wild-type. Reproduced and adapted with permission from Francius et al. (Citation2008b).

Figure 6. Panel (A) and (B). Electrochemical measurements in laboratory controlled model (Ecorr evolution and cathodic polarization curves, respectively). H2O2-induced ennoblement obtained in synthetic freshwater, simulating natural rivers, (a) before and after the addition of (b) H2O2 (2 mM, pH∼8), (c) free or (d) immobilized enzymes. Panels (C) and (D). Schematic representation of the enzymatic system used to generate H2O2. When enzymes (designated ‘E’) are free (C), the formation of H2O2 occurs randomly in the solution, while immobilized enzymes (D) catalyze the reaction near the SS surface, leading to an enrichment of H2O2 and depletion of O2.
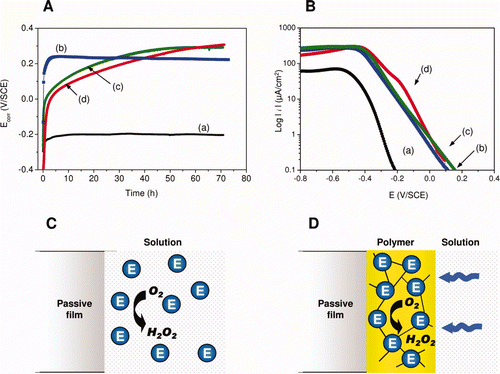
Figure 6. Panel (A) and (B). Electrochemical measurements in laboratory controlled model (Ecorr evolution and cathodic polarization curves, respectively). H2O2-induced ennoblement obtained in synthetic freshwater, simulating natural rivers, (a) before and after the addition of (b) H2O2 (2 mM, pH∼8), (c) free or (d) immobilized enzymes. Panels (C) and (D). Schematic representation of the enzymatic system used to generate H2O2. When enzymes (designated ‘E’) are free (C), the formation of H2O2 occurs randomly in the solution, while immobilized enzymes (D) catalyze the reaction near the SS surface, leading to an enrichment of H2O2 and depletion of O2.

Figure 7. Hypothetical polarization curves of the cathodic and anodic processes on SS under MIC conditions: before (t = 0) and after (t) the formation of H2O2, causing a cathodic and an anodic response. These mechanisms result in the shift of both the corrosion potential (Ecorr) and the pitting potential (Ep) towards anodic values.
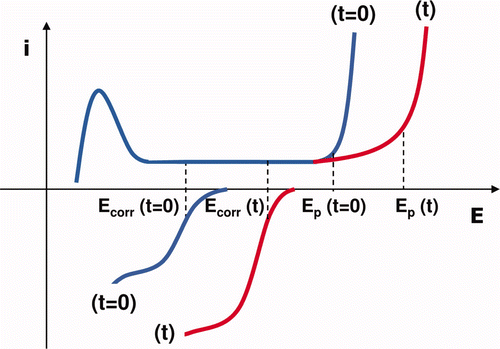
Figure 7. Hypothetical polarization curves of the cathodic and anodic processes on SS under MIC conditions: before (t = 0) and after (t) the formation of H2O2, causing a cathodic and an anodic response. These mechanisms result in the shift of both the corrosion potential (Ecorr) and the pitting potential (Ep) towards anodic values.

Figure 8. Light-dependent evolution of Ecorr on SS samples. Panel (A). Potential variation recorded in (a) natural exposure conditions (dam-water), (b) the same without light and (c) the same after addition of filter. Panel (B). Detailed Ecorr variation in a short period: the grey shaded regions indicate the night periods. Reproduced and adapted with permission from Liao et al. (Citation2010).
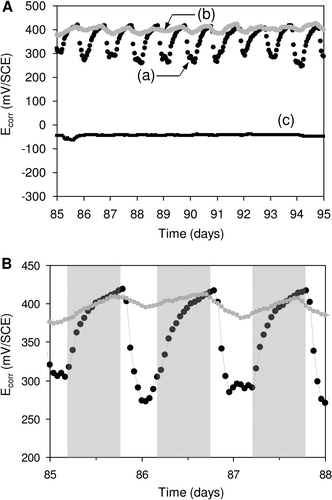
Figure 8. Light-dependent evolution of Ecorr on SS samples. Panel (A). Potential variation recorded in (a) natural exposure conditions (dam-water), (b) the same without light and (c) the same after addition of filter. Panel (B). Detailed Ecorr variation in a short period: the grey shaded regions indicate the night periods. Reproduced and adapted with permission from Liao et al. (Citation2010).

Figure 9. Proposed metabolic pathways to explain the possible involvement of diatoms in influencing the electrochemical behavior of SS. (a) Direct action via photosynthetic metabolic activity, influencing physico-chemical conditions of the SS/biofilm interface; (b) direct action via the effect of other diatom metabolic substances: production of reactive oxygen species (ROS) due to oxidative stress; (c) Indirect action by providing metabolic products, namely oxygen, to other microorganisms: potential metabolic interactions within the biofilms between diatom (phototrophic) and bacteria (heterotrophic).
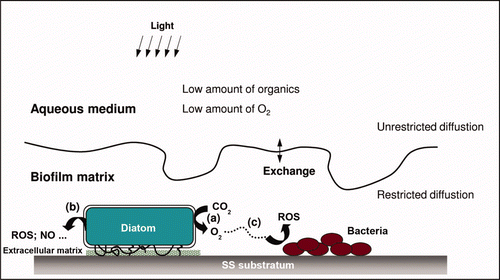
Figure 9. Proposed metabolic pathways to explain the possible involvement of diatoms in influencing the electrochemical behavior of SS. (a) Direct action via photosynthetic metabolic activity, influencing physico-chemical conditions of the SS/biofilm interface; (b) direct action via the effect of other diatom metabolic substances: production of reactive oxygen species (ROS) due to oxidative stress; (c) Indirect action by providing metabolic products, namely oxygen, to other microorganisms: potential metabolic interactions within the biofilms between diatom (phototrophic) and bacteria (heterotrophic).

Reprints and Corporate Permissions

Please note: Selecting permissions does not provide access to the full text of the article, please see our help page How do I view content?

To request a reprint or corporate permissions for this article, please click on the relevant link below:

Academic Permissions

Please note: Selecting permissions does not provide access to the full text of the article, please see our help page How do I view content?

Obtain permissions instantly via Rightslink by clicking on the button below:

If you are unable to obtain permissions via Rightslink, please complete and submit this Permissions form. For more information, please visit our Permissions help page.