Figures & data
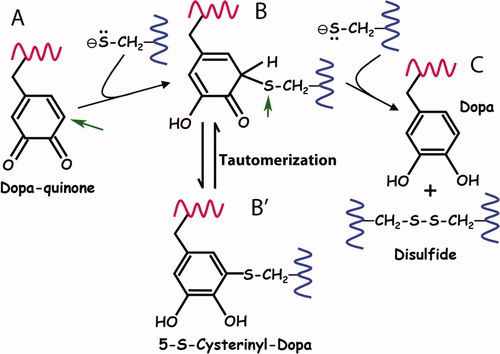
Figure 1. Comparison of an adhesive butt joint with mussel adhesion. (A) A layer of adhesive polymer mediates the force (F) transfer between adherend A and adherend B. (B) There are two length scales of byssal adhesion in a mussel (inset). At the macroscale, adherend A is the soft living tissue of the mussel, the adhesive polymer is the byssus and adherend B is a foreign substratum. In contrast, at a length scale of micrometers, adherend A is represented by the proteins in the plaque, the adhesive polymers are a consortium of mostly interfacial plaque proteins, and adherend B remains a foreign substratum. Both perspectives are important to understanding mussel fouling.
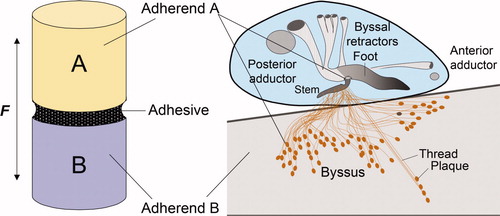
Figure 2. Schematic view of a mussel byssal plaque. (a) each plaque is made by the mussel (inset) in a few minutes in the distal depression of the foot; (b) molecular model of the plaque. Approximate distribution of known plaque proteins is shown in relation to the substratum (adherend B). Dopa-containing proteins nearest the interface with the substratum and with known adhesion to mica are mfp-3 (fast and slow), mfp-5, and mfp-6. Adapted from Hwang et al. (2010). ©The American Society of Biochemistry & Molecular Biology.
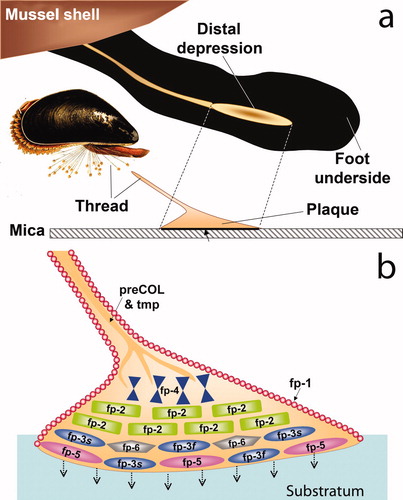
Table 1. Tally of Dopa-containing proteins present in the byssal plaques of Mytilus species (Me = M. edulis; Mc = M. californianus) and their respective adhesion to mica as measured by the surface forces apparatus. For best comparison, testing conditions in all cases were at pH 5.5, ionic strength 0.10 M, 1 atm and 20°C after a 60 min contact, and were selected to enable comparisons of all mfps. Note: maximal asymmetric adhesion to mica always occurs at pH 3.
Figure 3. Mass analysis of proteins in the distal depression during plaque formation induced by stimulating the pedal nerve. (a) pre-injection swab of proteins in the distal depression; (b) 1 min post-injection swab of distal depression; (c) 2 min post-injection swab; (d) 5 min post-injection swab; (e) 10 min post-injection swab; (f) proteins of a mature plaque footprint; (g) purified mfp-3 protein variants (5.3 kDa peak mass) used in SFA experiments; (h) purified mfp-6 variants (11.6 kDa) used in SFA experiments. Note absence of mfp-5 (9.5 kDa) which requires much higher laser power to desorb during analysis by MALDI. Adapted from Yu et al. (2011b). © Nature Publishing Group.
Figure 4. Adhesion and cohesion of mfps as determined by the surface forces apparatus (SFA). (a) Deposition of protein films by adsorption to freshly cleaved mica. A monolayer adsorbed onto one mica surface is denoted as asymmetric mode and is suitable for measuring adhesion during approach-separation runs in the SFA because adhesion will only occur if the protein engages in energetic interactions with both surfaces. In symmetric mode, a protein monolayer is adsorbed to both mica surfaces such that in approach-separation runs, cohesive interactions of mfps can be explored. (b) Three approach (in) –separation (out) runs of an asymmetric mefp-3 film on mica at pH 3, 5.5 and 7.5 that reveal the high pH-dependence of mfp-3f adhesion. (c) Rescue of adhesion by addition of pmole amounts of mfp-6 at pH 5.5. (d) Enhanced rescue of adhesion at pH 3 by mfp-6 with nearly full recovery after preincubation for 60 min. (e) Dependence of adhesion rescue by mfp-6 on its cysteine thiolates. CM-mfp-6 denotes protein with cysteines that have been S-alkylated by iodoacetic acid. Adapted from Yu et al. (2011b). © Nature Publishing Group.
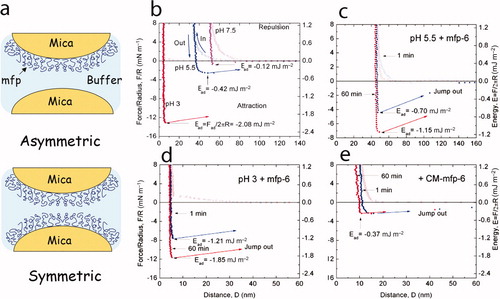
Figure 5. Free radical reporter of antioxidant activity 1,1-diphenyl-2-picrylhydrazyl (DPPH•). (a) UV-Vis spectrum (300–800 nm) of DPPH• in its oxidized free radical (purple spectrum) and reduced (yellow spectrum) forms. The absorbance maximum (molar absorptivity) of DPPH at ∼515 nm decreases to its yellow-orange hydrazine counterpart (DPPH-H) upon the addition of an antioxidant. Inset: the reaction mixture (40% v/v 0.1M sodium acetate and 60% v/v methanol, pH 5.5) with 50 μM DPPH radical alone and in the presence of 10 μM L-ascorbic acid or 10 μM mfp6 after incubation for 30 min. (b) Time course of DPPH• reduction with the antioxidants L-cysteine, L-ascorbic acid and mfp6 protein at pH 4.0. 1 ml of a 0.1 M citrate phosphate reaction buffer contained 0.3% (v/v) Triton X-100 and 100 μM DPPH• alone or supplemented with 5 μM of L-cysteine, L-ascorbic acid or mfp6. The reaction was started by the addition of the antioxidant and the decrease in absorbance was monitored at 515 nm. The absorbance of DPPH• without antioxidant addition was stable over 60 min. For clarity, the control absorbance of 100 μM DPPH is displayed as 100% DPPH radical.
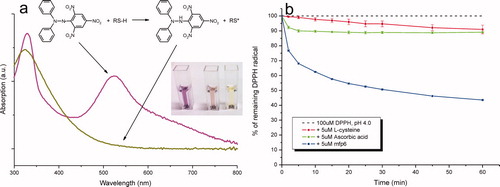
Figure 6. A model of redox control during the initial stages of adhesive plaque formation by the foot. (a) The cup-shaped ventral surface of a mussel foot placed over a patch of substratum defines the microenvironment over which a new regime of pH, ionic strength, and redox conditions distinct from the surrounding seawater will be imposed. KCl-induced protein secretion by the foot mimics plaque formation and exhibits a microenvironment that is acidic pH ∼5, low ionic strength <0.1 M and strongly reducing. Reducing activity comes mostly from thiolate groups in mfp-6, pairs of which are converted to disulfides for every quinone rescued as Dopa. (b) Integrated view of parameters influencing redox during plaque formation. Red parameters denote standard redox potential, equilibrium and ionization constants of Dopa; blue parameters denote standard redox, equilibrium and ionization constants of thiolates. Acidity [H+] is purple. The biggest and most interesting uncertainty is to what extent a mussel can tailor redox to specific surfaces.
![Figure 6. A model of redox control during the initial stages of adhesive plaque formation by the foot. (a) The cup-shaped ventral surface of a mussel foot placed over a patch of substratum defines the microenvironment over which a new regime of pH, ionic strength, and redox conditions distinct from the surrounding seawater will be imposed. KCl-induced protein secretion by the foot mimics plaque formation and exhibits a microenvironment that is acidic pH ∼5, low ionic strength <0.1 M and strongly reducing. Reducing activity comes mostly from thiolate groups in mfp-6, pairs of which are converted to disulfides for every quinone rescued as Dopa. (b) Integrated view of parameters influencing redox during plaque formation. Red parameters denote standard redox potential, equilibrium and ionization constants of Dopa; blue parameters denote standard redox, equilibrium and ionization constants of thiolates. Acidity [H+] is purple. The biggest and most interesting uncertainty is to what extent a mussel can tailor redox to specific surfaces.](/cms/asset/ca95cc01-baee-420a-b831-3e14df9c7289/gbif_a_719023_o_f0006g.jpg)
Figure 7. Proposed reaction mechanism for the reduction of quinone by thiolates. (A)The first thiolate attacks the o-quinone of Dopa at the 5-C position (arrow) in a Michael reaction. (B) The covalent thio-quinone adduct has a tetrahedral 5-C which is prone to further attack at the 5-S (arrow) by the second thiolate. (C) In the attack by the second thiolate, the 5-S leaves behind the electron pair it shared with 5-C and splits off as a disulfide thereby regenerating Dopa. (B’) The thio-quinone intermediate (structure B) is related by tautomerization with 5-S-cysteinylDopa (structure B′). Tautomers share the same oxidation level but exhibit relocation of electrons, ie double bonds. Adapted from Inaba (2010).