Figures & data
Table 1. Wettability properties of the test surfaces used, as determined by static contact angle measurements.
Figure 1. Mean density of bacterial cells obtained from biofilms formed from (a) NSW (n = 360 for each surface) and (b) C. marina (n = 630 for each surface) on a range of test surfaces. Error bars represent ± 2 × SE. For the two figures, values that are significantly different to each other at p < 0.05, are indicated by different letters above the bars.
Figure 2. Epifluorescence micrographs showing a general view of biofilms formed from NSW (a and b) and from C. marina (c and d) on IS700 and glass stained with SYTO13® dye. Image size: 225 μm×170 μm.
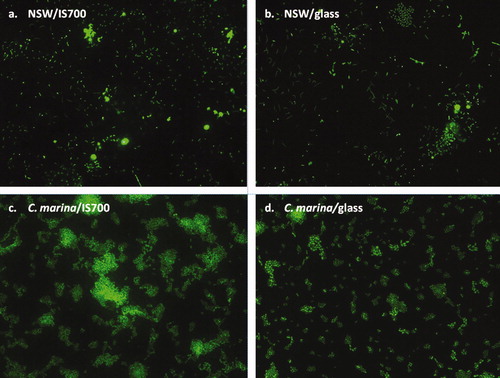
Figure 3. Effect of bacterial biofilms formed from NSW on the settlement and the adhesion strength of spores of U. linza on a range of test surfaces. (a) Mean density of settled spores on control (non-biofilmed) and biofilmed surfaces obtained from three replicate slides (n = 90). Error bars represent ± 2×SE. (b) Mean percentage removal of spores from control and biofilmed surfaces, calculated from the counts of three replicates exposed to 52 Pa shear stress compared with the three unexposed replicates. Error bars represent ± 2×SE, calculated from arcsine-transformed data. For the two figures, asterisks show values that are significantly different to control surfaces (ANOVA, p < 0.05).
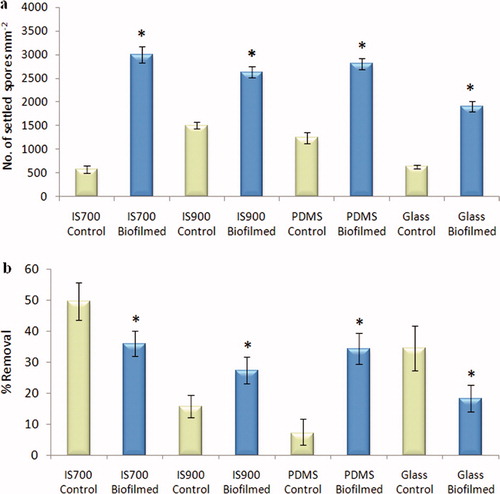
Figure 4. Effect of bacterial biofilms formed from NSW on the settlement and the adhesion strength of sporelings of U. linza on a range of test surfaces. (a) Mean biomass of sporelings on control (non-biofilmed) and biofilmed surfaces before exposure to shear stress obtained from the measure of the chlorophyll fluorescence (RFU) on six replicate slides. Error bars represent ± 2×SE. (b) Mean percentage removal of sporelings from control and biofilmed surfaces, after exposure to a shear stress of 10 Pa for IS900, 24 Pa for PDMS and IS700 and 52 Pa for glass, obtained from RFU determinations on six replicate slides before and after exposure to flow. Error bars represent ± 2×SE and were calculated from arcsine-transformed data. For the two figures, asterisks show the values that are significantly different to control surfaces (ANOVA, p < 0.05).
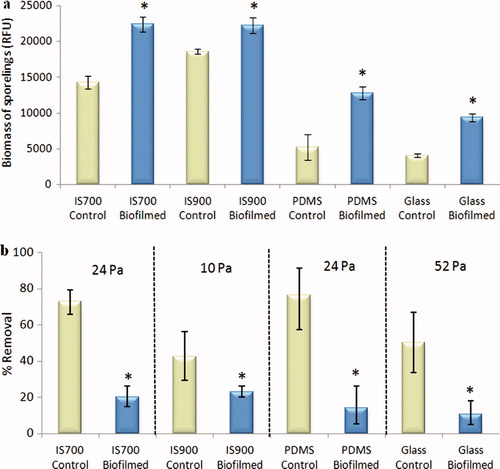
Figure 5. Effect of bacterial biofilms of C. marina on the settlement and the adhesion strength of spores of U. linza on a range of test surfaces. (a) Mean density of settled spores on control (non-biofilmed) and biofilmed surfaces obtained from the count of three replicate slides (n = 90). Error bars represent ± 2×SE. (b) Mean percentage removal of spores on control and biofilmed surfaces, calculated from the counts of three replicate slides exposed to 52 Pa shear stress compared with the three unexposed replicate slides. Error bars represent ± 2×SE calculated from arcsine-transformed data. For the two figures, asterisks show the values that are significantly different to control surfaces (ANOVA, p < 0.05).
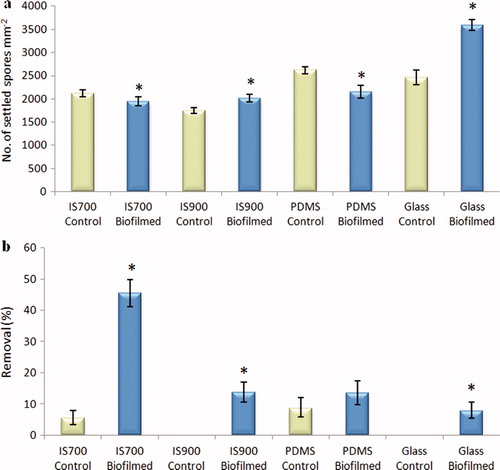
Figure 6. Effect of biofilm densities of C. marina on the adhesion strength of spores of U. linza on IS700. (a) Mean density of bacterial cells obtained from the count of three replicate slides (n = 90). Error bars represent ± 2×SE. Values that are significantly different to each other at p < 0.05, are indicated by different letters above the bars. (b) Mean percentage removal of spores on biofilmed IS700 surfaces, calculated from the counts of three replicate slides exposed to 52 Pa shear stress compared with the three unexposed replicate slides. Error bars represent ± 2×SE, calculated from arcsine-transformed data.
Figure 7. Effect of biofilms of C. marina on the settlement and the adhesion strength of sporelings of U. linza on a range of test surfaces. (a) Mean biomass of sporelings on control (non-biofilmed) and biofilmed surfaces before exposure to shear obtained from the measure of chlorophyll fluorescence (RFU) on six replicate slides. Error bars represent ± 2×SE. (b) Mean percentage removal of sporelings on control and biofilmed surfaces, after exposure to a shear stress of 10 Pa for IS900, 24 Pa for PDMS and IS700 and 52 Pa for glass obtained from RFU determinations on six replicate slides before and after exposure to flow. Error bars represent ± 2×SE calculated from arcsine-transformed data. For the two figures, asterisks show the values that are significantly different to control surfaces (ANOVA, p < 0.05).
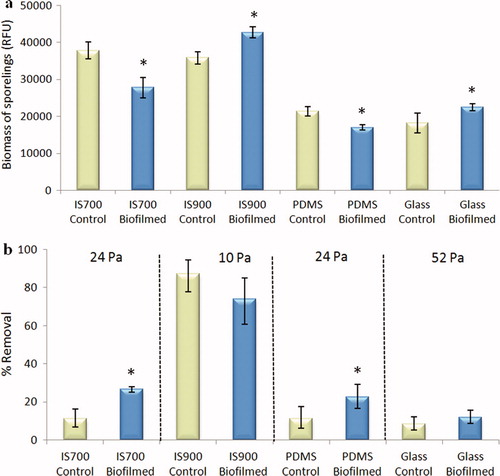
Figure 8. Confocal microscope micrographs showing settled spores of U. linza (revealed in red due to chlorophyll auto-fluorescence) on test surfaces with the presence of bacterial biofilm formed from NSW (revealed in green due to SYTO13® dye). (a and b) Composite images showing settled spores adjacent to bacterial aggregates on IS700, (c) Composite image showing settled spores underneath bacteria on glass and, (d and e) Sagittal/Z sections of the composite image (c), showing settled spores underneath bacteria. Scale bar = 5 μm.
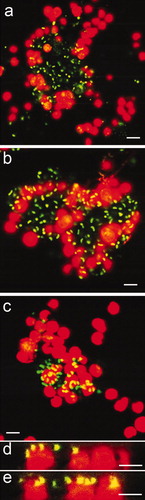
Figure 9. Confocal microscope micrographs showing settled spores of U. linza (revealed in red due to chlorophyll auto-fluorescence) on test surfaces with the presence of bacterial biofilm formed from C. marina (revealed in green due to SYTO13® dye). (a) Composite image showing settled spores adjacent to bacterial aggregates and partially settled under the bacteria (arrows) on IS700. (b and c) Sagittal/Z sections of the composite image (a), settled spores underneath bacteria. (d) Composite image showing settled spores adjacent to bacterial aggregates and under the bacteria (arrows) on IS900, (e and f) Sagittal/Z sections of the composite image (d), showing settled spores underneath bacteria and, (g) composite image showing settled spores adjacent to bacteria on glass. A spore undergoing settlement (arrow) was able to move bacteria from the settlement site by the motion of its flagella. Scale bar = 5 μm.
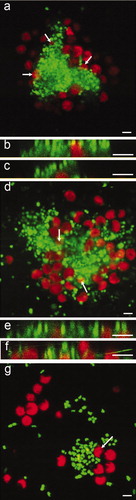
Figure 10. Effect of bacterial biofilms formed from NSW on settlement and adhesion strength of cells of N. incerta on a range of test surfaces. (a) Mean density of settled cells on control (non-biofilmed) and biofilmed surfaces obtained from the count of three replicate slides (n = 90). Error bars represent ± 2×SE. (b) Mean percentage removal of cells on control and biofilmed surfaces calculated from the counts of three replicates exposed to 40 Pa shear stress compared with three unexposed replicate slides. Error bars represent ± 2×SE were calculated from arcsine-transformed data. For the two figures, asterisks show the values that are significantly different to control surfaces (ANOVA, p < 0.05).
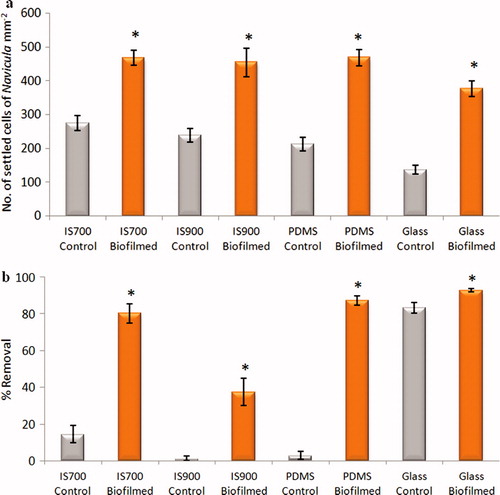
Figure 11. Effect of bacterial biofilms formed form C. marina on settlement and adhesion strength of cells of N. incerta on a range of test surfaces. (a) Mean density of settled cells on control (non-biofilmed) and biofilmed surfaces obtained from the count of three replicate slides (n = 90). Error bars represent ± 2×SE. (b) Mean percentage removal of cells from control and biofilmed surfaces calculated from the counts of three replicates exposed to 40 Pa shear stress compared with three unexposed replicate slides. Error bars represent ± 2×SE were calculated from arcsine-transformed data. For the two figures, asterisks show the values that are significantly different to control surfaces (ANOVA, p < 0.05).
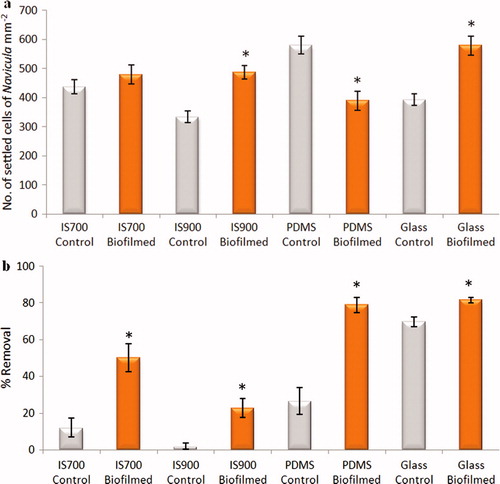
Figure 12. Effect of different biofilm densities of C. marina on the adhesion strength of cells of N. incerta on IS700. (a) Mean density of bacterial cells obtained from the counts of three replicate slides (n = 90). Error bars represent ± 2×SE. Values that are significantly different to each other at p < 0.05, are indicated by different letters above the bars. (b) Mean percentage removal of cells on biofilmed IS700 surfaces, calculated from the counts of three replicate slides exposed to 52 Pa shear stress compared with three unexposed replicate slides. Error bars represent ± 2×SE, calculated from arcsine-transformed data.