Figures & data
Table 1. Summary of information on the three known D. polymorpha foot proteins (Dpfp).
Figure 1. Electrophoretic separation of zebra mussel byssal proteins extracted from induced, freshly secreted byssal threads. Proteins extracts were loaded on 16% Tricine PAGE gels and silver-stained. (A) Byssal proteins identified in an extract from ∼33 complete byssal threads and plaques (T/P). Left lane: Colorburst molecular weight ladder. (B) Byssal proteins identified in the extracts from ∼57 separated threads and plaques. Arrows indicate bands observed on the gel, some of which are quite faint. Underlined proteins represent novel byssal foot proteins that we have named Dpfp0 (>210 kDa), Dpfp4 (>90 kDa) and Dpfp5 (∼30 kDa). The other protein bands correspond to the molecular weights of previously known DOPA containing foot proteins: Dpfp1 (76, 65 kDa) and Dpfp2 (26 kDa).
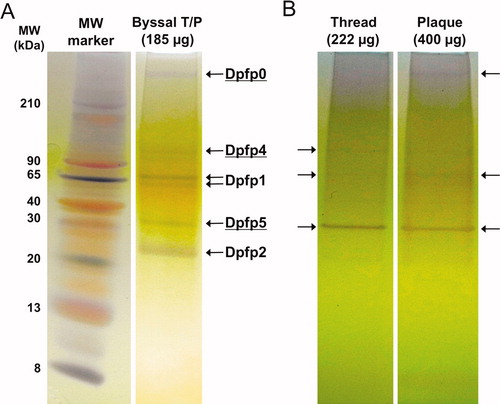
Table 2. Summary of peptide mass fingerprinting identification of three gel bands from induced byssal material extract.
Figure 2. Illustration of the pattern of repeats identified in the EST derived sequence of Dpfp5 (AM230139). The adaptor sequence inserted during cDNA cloning has been excluded and the N-terminus of the sequence is incomplete. Alternating underlined and non-underlined green highlighted sequences represent proline and glutamine rich triads. Blue, grey and yellow highlights represent other repeat sequences. Cysteine residues are indicated in red.
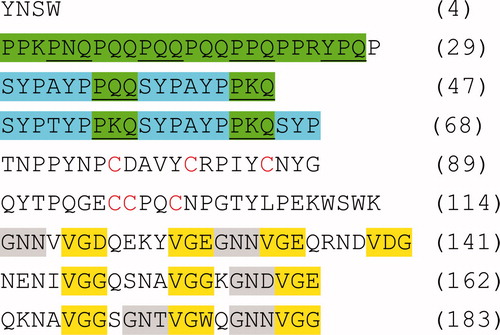
Figure 3. Illustration of the tandem repeat pattern identified in the EST derived sequence of Dpfp2 (AM229730). The sequence consists of five full repeats of a 22 residue consensus sequence KTY(P/E)AYPTK(Q/D)SYPVYPEKKYTE where non-italicized residues represent highly conserved residues. Each full repeat is on a new line and tyrosine residues with conserved positions within the consensus are indicated in bold. The underlined residues indicate post-translational modifications; Q and Y signify glutamine deamidation and tyrosine hydroxylation to DOPA, respectively.
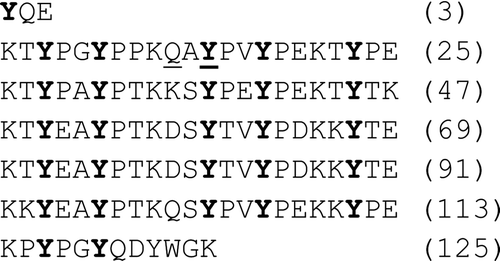
Figure S1. Alignment of the multiple EST sequence matches for the Dpfp5 gel band in Figure 1A. Bracketed numbers represent the reading frame of the virtually translated EST sequence. The peptide matches are aligned and color-coded to show regions of sequence similarity between matches. The orange code represents adaptor sequences added during cDNA amplification. The colors red (100%), blue (75%) and purple (50%) represent the percent sequence similarity between different EST matches. The yellow highlight represents peptide sequences that matched from the tryptic fragments. * = residues that are conserved between all EST matches. The first accession number is the sequence that was used for further analysis.
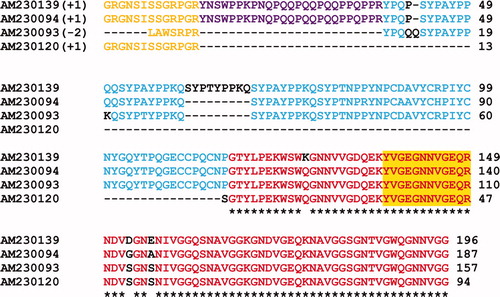
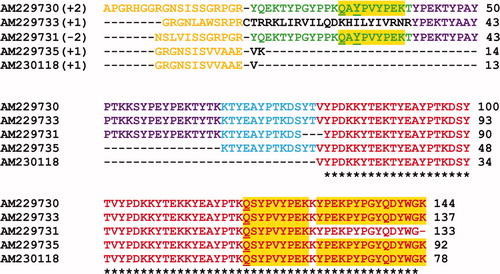
Figure S2. Alignment of the multiple EST sequence matches derived for the Dpfp2 (26 kDa) gel band in Figure 1A. Bracketed numbers represent the reading frame in which the EST sequence was virtually translated. The peptide matches are aligned and color-coded to show regions of similarity between matches. The orange sequence at the N-terminus represents adaptor sequences added during cDNA amplification. The colors red (100%), blue (80%), purple (60%) and green (40%) represent the percent sequence similarity among the EST matches. The yellow highlight represents peptide sequences that matched directly from the tryptic digest. Q and Y signify glutamine deamidation and tyrosine hydroxylation to DOPA, respectively. * = residues that are conserved between all EST matches. The first accession number is the sequence that was used for further analysis.