Publication Cover
Biofouling
The Journal of Bioadhesion and Biofilm Research
Volume 32, 2016 - Issue 9
2,542
Views
33
CrossRef citations to date
0
Altmetric
Articles

Profiling of adhesive-related genes in the freshwater cnidarian Hydra magnipapillata by transcriptomics and proteomics

, , , , , , & show all
Pages 1115-1129 | Received 09 Jun 2016, Accepted 01 Sep 2016, Published online: 23 Sep 2016

Figures & data

Figure 1. The model organism Hydra. (A) Micrograph of an adult polyp. The arrow indicates the basal disc. (B) Scheme of an adult polyp indicating details of the animal morphology. (C) Squeezed preparation of the peduncle region. The square indicates the area magnified in D. (D) The arrowheads point at individual ectodermal basal disc cells. (E–H) Different polyp conditions used for the RNA sequencing, transcriptome assembly and differential gene expression. (E) Whole polyp with bud; (F) whole polyp without bud; (G) amputated anterior part; and (H) amputated peduncle. te=tentacles, hy=hypostome, gc=gastric column, pe=peduncle, m=mesoglea, bd=basal disc. Scale bars=(A) 1 mm, (C, D) 50 μm.

Figure 1. The model organism Hydra. (A) Micrograph of an adult polyp. The arrow indicates the basal disc. (B) Scheme of an adult polyp indicating details of the animal morphology. (C) Squeezed preparation of the peduncle region. The square indicates the area magnified in D. (D) The arrowheads point at individual ectodermal basal disc cells. (E–H) Different polyp conditions used for the RNA sequencing, transcriptome assembly and differential gene expression. (E) Whole polyp with bud; (F) whole polyp without bud; (G) amputated anterior part; and (H) amputated peduncle. te=tentacles, hy=hypostome, gc=gastric column, pe=peduncle, m=mesoglea, bd=basal disc. Scale bars=(A) 1 mm, (C, D) 50 μm.

Table 1. Summary of the Hydra magnipapillata transcriptome assembly.

Figure 2. Distribution of expression values between (A) the whole polyp vs the anterior part and (B) the whole polyp vs the peduncle. Red dots symbolise transcripts with fold change equal or higher than 2, green dots represent fold change equal or smaller than 2, and black dots symbolise transcripts not passing the threshold of 0.95 for the estimated posterior probability of differential expression. wp: whole polyp, an=anterior part, pe=peduncle.

Figure 2. Distribution of expression values between (A) the whole polyp vs the anterior part and (B) the whole polyp vs the peduncle. Red dots symbolise transcripts with fold change equal or higher than 2, green dots represent fold change equal or smaller than 2, and black dots symbolise transcripts not passing the threshold of 0.95 for the estimated posterior probability of differential expression. wp: whole polyp, an=anterior part, pe=peduncle.

Figure 3. Whole mount in situ hybridisation of transcripts expressed in the peduncle and potentially involved in the adhesive mechanism of Hydra. Scale bars: 500 μm.
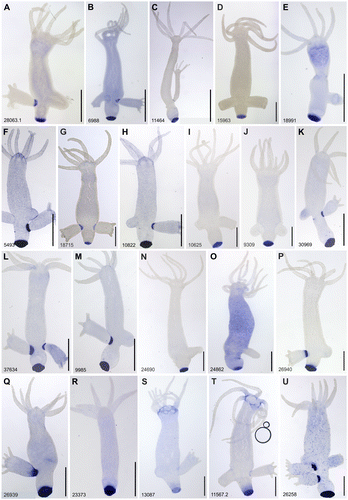
Figure 3. Whole mount in situ hybridisation of transcripts expressed in the peduncle and potentially involved in the adhesive mechanism of Hydra. Scale bars: 500 μm.

Table 2. Top Blast hits of the potential adhesive proteins by protein family and the NCBI non-redundant database.

Supplemental material

GBIF_1233325_Supplementary_material.docx

Download MS Word (13 MB)