Figures & data
Figure 1. Qualitative and quantitative analysis of biofilm formation conducted in a 24-well microtiter plate (modified from Lutskiy et al. Citation2015; Jung et al. Citation2018).
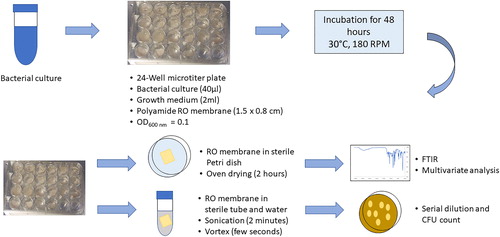
Figure 2. FTIR spectra of RO membranes after exposure to different media in the presence of H. aquamarina (incubation: 48 h at 30 °C; concentration: 1g l−1). Virgin RO – pure RO membrane surface; Negative control – MSM (no carbon source) with bacteria and MSM + carbon source (acrylic/maleic/poly acrylic acid/glucose) without bacteria; Positive control – glucose in MSM; AA + MSM – acrylic acid in MSM; PAA + MSM – poly acrylic acid in MSM; MA + MSM – maleic acid in MSM.
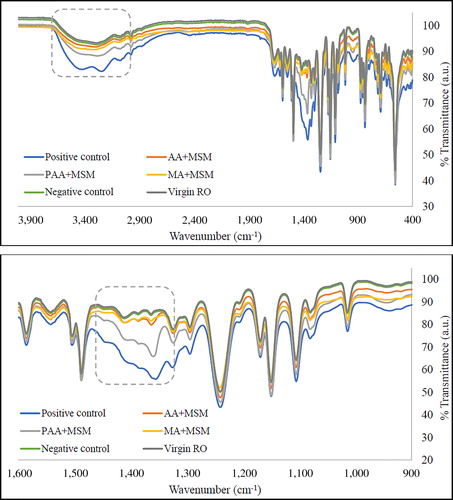
Table 1. Peak assignments to characterize biofilm layerTable Footnote*.
Figure 3. Increase in absorbance for selected peaks representing: (A) fatty acids and phospholipids, (B) polysaccharides, (C) protein components of the biofilm layer. Neg. control – MSM (no carbon source) with bacteria, and MSM + carbon source (acrylic/maleic/poly acrylic acid/glucose) without bacteria; Pos. control – glucose in MSM; AA + MSM – acrylic acid in MSM; PAA + MSM – poly acrylic acid in MSM; MA + MSM – maleic acid in MSM.
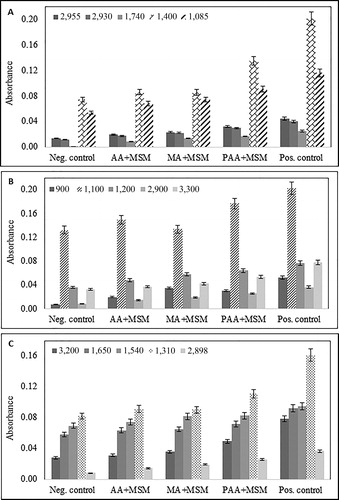
Figure 4. Clustering of variables obtained through PCA using The Unscrambler (V10.5).
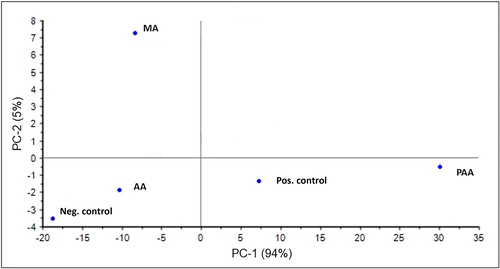
Figure 5. Biplot obtained for (A) the proteins; (B) the fatty acids and phospholipids; (C) the polysaccharide components of the biofilm using XLSTAT (V2016).
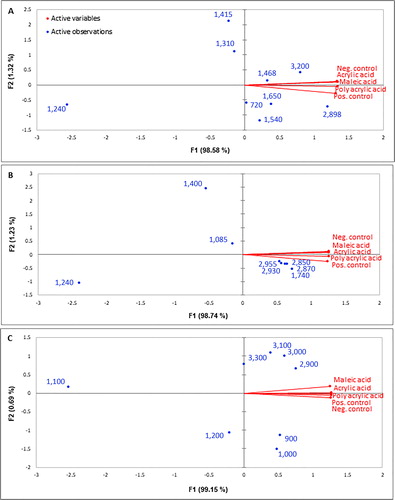
Figure 6. Clustering of the biofilm components obtained in the presence of different carbon sources.
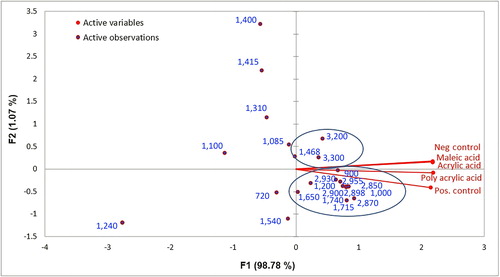
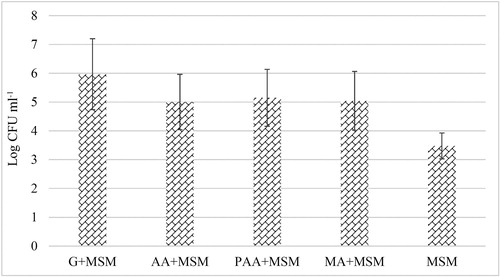
Figure 7. CFU counts obtained from biofouled RO membranes.