Figures & data
Figure 1. Dimensions of hull steel panels, with cleaning paths marked in grey, i.e. theoretical area covered by maximum wall shear stress. Locations for dry film thickness measurements are labelled L1 – R3.
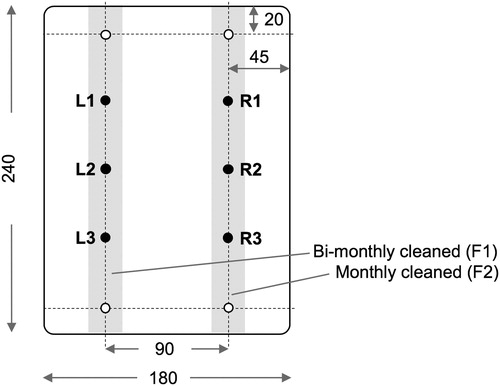
Figure 2. Schematic representation (lateral view) of the immersed waterjet.
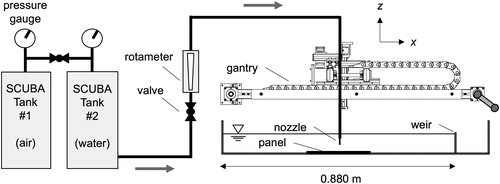
Table 1. Maximum wall shear stress τw,max and stagnation pressure ps at the wall (Equations 1 and 2, respectively), as a function of flowrate Q through a pipe nozzle with D = 1.6 mm, at standoff distances H = 25 mm and 16 mm.
Table 2. Cleaning schedule, with indication of nozzle standoff distance H used on each date.
Table 3. US Naval Ships’ Technical Manual fouling rating, frNSTM (Naval Sea Systems Command Citation2006).
Figure 3. Areal-mean fouling rating vs time, for different coatings (AF, E, FR) and cleaning frequencies: (a) no cleaning, F0; (b) bi-monthly cleanings, F1; (c) monthly cleanings, F2. For E panels, plotted values correspond to the final stage after each period of one-month exposure, corresponding to 12 different panels deployed and retrieved on a monthly basis. For AF panels, the nozzle translation speed was varied (S1: 0.01 m s−1; S2: 0.02 m s−1; S3: 0.03 m s−1).
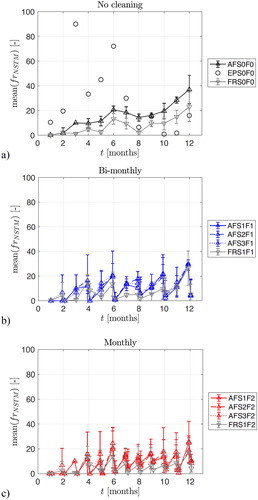
Figure 4. Representative examples of fouling rating: (a) E panel (March 2019, t = 11 months): frNSTM = 10 (15%), frNSTM = 30 (1%); (b) E panel (October 2018, t = 6 months): frNSTM = 30 (20-40%), frNSTM = 90 (60-80%); (c) non-cleaned AF panel (April 2019, t = 12 months): frNSTM = 30 (100%); (d) cleaned AF panel (April 2019, t = 12 months): frNSTM = 10 (3-99%), frNSTM = 20 (0-1%); (e) non-cleaned FR panel (April 2019, t = 12 months): frNSTM = 10 (30-40%), frNSTM = 20 (0-30%), frNSTM = 30 (0-50%), frNSTM = 90 (5-40%); (f) cleaned FR panel (April 2019, t = 12 months): frNSTM = 10 (30-60%).
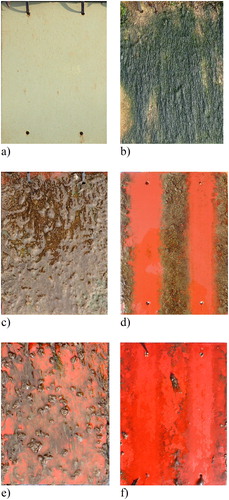
Figure 5. Time-averaged fouling rating, calculated from areal-mean fouling rating along time using the trapezoidal rule (EquationEquation 4(4)
(4) ), where error bars correspond to propagated 95% confidence intervals: (a) AF and FR panels, with either no cleaning or constant translation speed (S0 for no cleaning; S1 for 0.01 m s−1) and varying cleaning frequency (F0 – no cleaning, F1 – bi-monthly, F2 – monthly); (b) AF panels, with varying translation speed (S1: 0.01 m s−1; S2: 0.02 m s−1; S3: 0.03 m s−1).
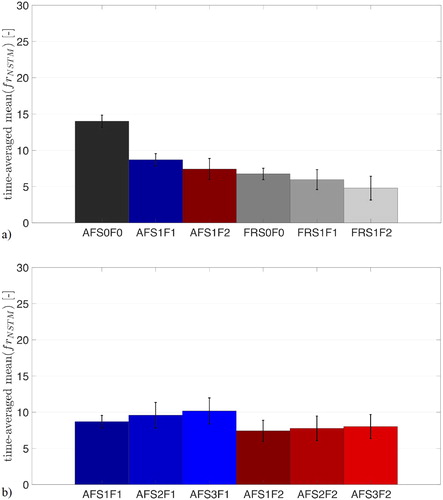
Figure 6. Adhesion strength, or local cleaning areal forces (in Pa), used in different points in time, depending on cleaning results, for two fouling control coatings (AF and FR), three cleaning frequencies (F0 – no cleaning; F1 – bi-monthly cleanings; F2 – monthly cleanings) and three nozzle translation speeds (S1: 0.01 m s−1; S2: 0.02 m s−1; S3: 0.03 m s−1): (a) maximum wall shear stress τw,max; (b) stagnation pressure ps. Error bars correspond to 95% confidence intervals.
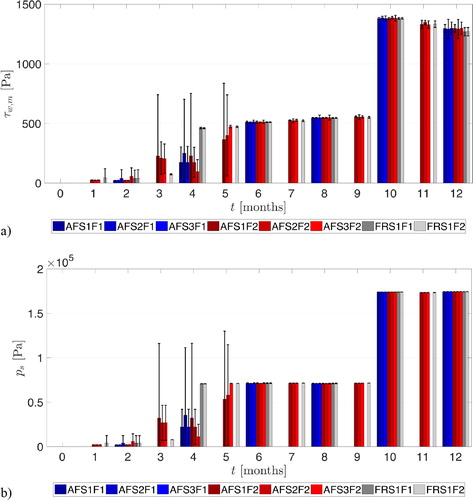
Table 4. Barnacle counting on epoxy anti-corrosive (E) and foul-release (FR) coated panels, individuals dm-2 (mean ± 95% confidence interval), before/after each cleaning event.
Figure 7. Paint polishing for each treatment, together with corresponding copper release rate (Kruskal-Wallis test: p = 0.6). Error bars correspond to 95% confidence intervals.
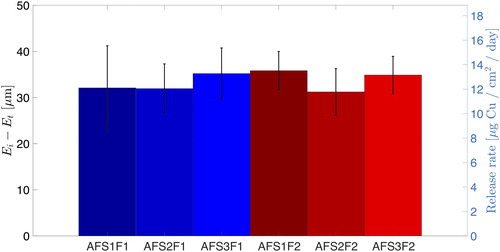
Figure 8. SEM imaging of coating cross-sections (AF), where the surface of the coating is on the left-hand side (approximate leached layer thickness is marked by double arrows), together with element-count profiles along depth, from EDX analysis: (a) newly applied; (b) immersed non-cleaned – AFS0F0; (c) immersed and cleaned bi-monthly – AFS1F1); (d) immersed and cleaned monthly – AFS1F2. Element abundance is expressed as a ratio between EDX counts and average counts on deeper, intact layers of the coating. Scale bars (upper right corner on SEM images) correspond to 50 μm, and error bars correspond to 95% confidence intervals for 30 line scans.
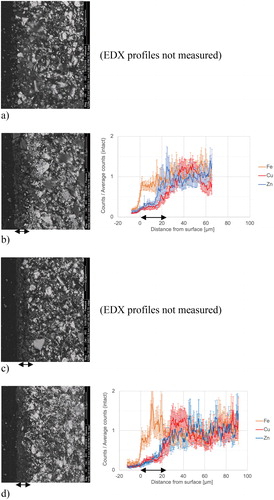
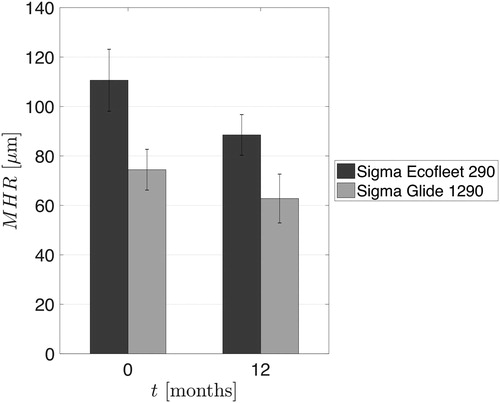
Figure 9. Peak-to-valley roughness height, MHR (Mean Hull Roughness), for anti-fouling paint PPG Sigma Ecofleet® 290 (AF panels) and foul-release PPG Sigmaglide® 1290 (FR panels), before or after immersion and waterjet cleaning (Kruskal-Wallis test: p = 0.0010 and 0.0014, at t = 0 and 12 months, respectively). Error bars correspond to 95% confidence intervals for n cleaned panels under each coating, i.e. n = 18 AF panels (triplicates of six cleaning treatments were pooled) and n = 6 FR panels (triplicates of three cleaning treatments were pooled).