Figures & data
Figure 1. Diagrammatic representation of the flume design. Water was pumped from the sea by a 37,800GPH pump placed on a marina dock. Large hoses and their couplings connected the water source to the pump and flume. The flume was 1.8 m long and 10.2 cm × 5.5 cm in cross-section in the area of the panel chamber. Flume input and output including connecting hoses were 10.2 cm in diameter. The flume hatch allowed panels to be installed flush with the interior walls and a flow/knot meter provided real-time flow data. Control valves at the couplings for the discharge hose allowed flow to be diverted and regulated during panel swaps.
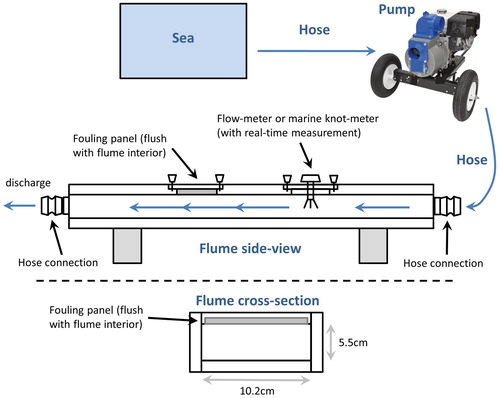
Figure 2. Biofouling cover on settlement panels with varying in-water durations and different coatings. The mean percentage cover of biofouling and the SD are shown for panels (n = 8 per treatment) under static conditions (i.e. before being subjected to the flume). The control panels showed a substantial increase in biofouling after immersion for 10 days. The A/F coating maintained low levels of biofouling accumulation under static conditions at both sites. The F-R coating had a notable accumulation at the West Coast site under static conditions.
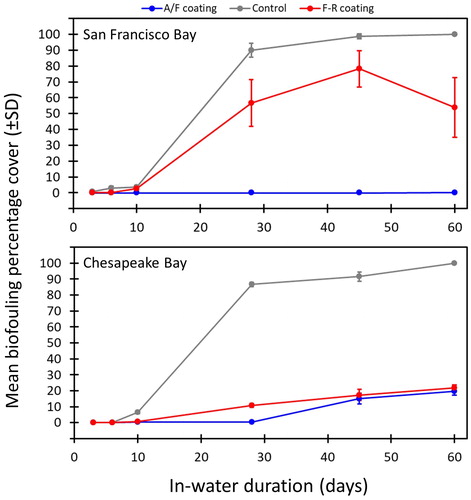
Table 1. Species occurrence on biofouling panels after being subjected to the flume.
Figure 3. Effect of water movement on biofouling cover. The mean (and SD) biofouling percentage cover is shown for panels pre- and post-flume exposure after submergence for 28-, 45-, and 60-days. The AF fouling coating (A/F) is shown in dark blue (pre-flume) and light blue (post-flume); the FR coating (F-R) is shown in red (pre-flume) and pink (post-flume); control panels are shown in dark and light grey (pre- and post-flume, respectively). West Coast (San Francisco Bay) and East Coast (Chesapeake Bay) sites are shown on the left and right sides of each plot.
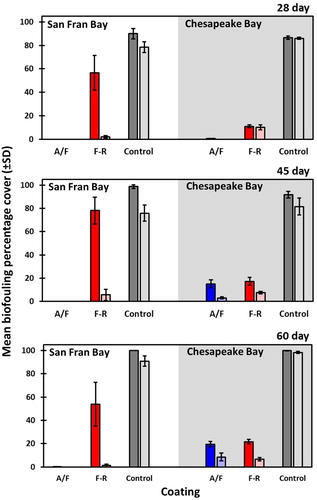
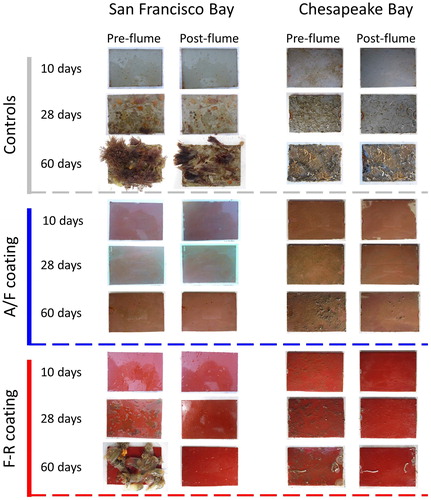
Figure 4. Photographs of biofouling panels before- and after-flume processing. Representative examples of panels for 10-, 28- and 60-days immersion periods are shown by coating treatment (controls, A/F, and F-R). Paired images show the same panel before (left) and after (right) being subjected to the flume.