Figures & data
Figure 1. Dose-dependent effect of 4 h exposure to XZ.700 on the viability of 24 h (white bars) and 48 h (black bars) old MRSA biofilms. *Significant reduction in biofilm viability compared with the control, p < 0.05.
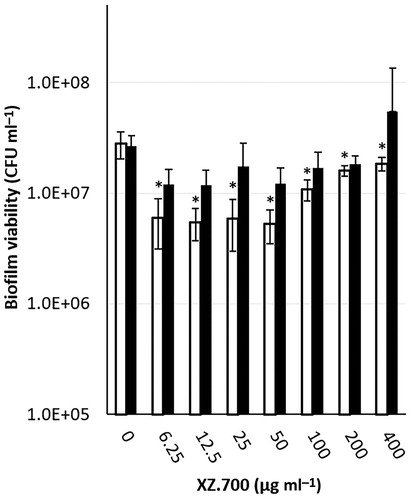
Figure 2. Comparison of the effect of 4 h exposure to XZ.700 (12.5, 25 and 50 µg ml−1), PVP-I (0.35%), and gentamicin (1000 µg ml−1) on biofilm viability in 24 h (white bars) and 48 h (black bars)-old MRSA biofilms. *Significant reduction in biofilm viability compared with the no treatment control, p < 0.05.
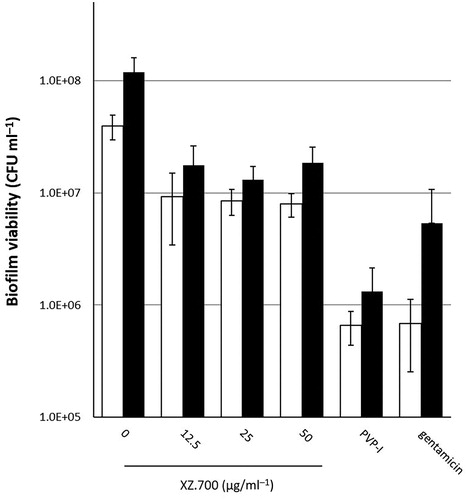
Figure 3. Panel A: Comparison of the effect of exposure times to XZ.700 (25 µg ml−1) on the viability of 24 h-old (dashed line) and 48 h-old (solid line) MRSA biofilms. *Significant reduction in CFU ml−1 compared with the control, p < 0.05. Panel B: Comparison of the effect of a single hit, two hits and four hits of XZ.700 (25 µg ml−1 and 6.25 µg ml−1) on the viability of 24 h-old (white bars) and 48 h-old (black bars) MRSA biofilms. *Significant reduction in CFU ml−1 compared with the respective single hit control (1 x 120 min) and four hit control (4 x 30 min), p < 0.05. **Significant reduction in CFU ml−1 compared with the four hit control (4 x 30 min), p < 0.05.
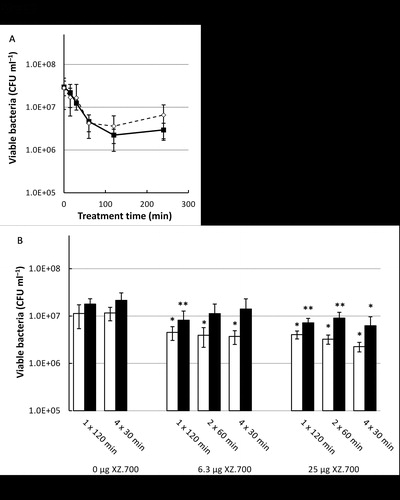
Figure 4. Comparison of the effect of 4 h exposure to XZ.700 (25 µg ml−1), DNase I (50 U ml−1) and both combined, on the viability of 24 h-old (white bars) and 48 h-old (black bars) MRSA biofilms. *Significant reduction in biofilm viability compared with the respective no-treatment controls, p < 0.05.
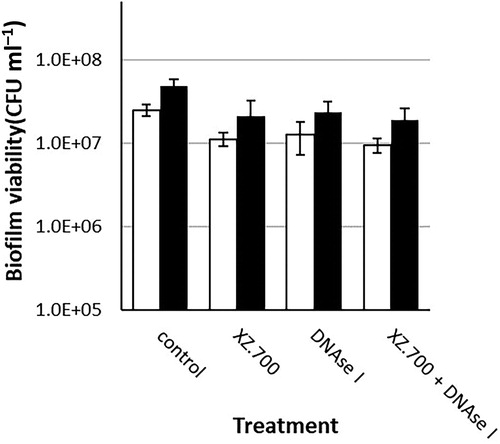
Figure 5. Time lapse microscopic images of the effect of different treatments on 16 h-old MRSA biofilms cultured under flow conditions. Images obtained 1 min (left column) and 15 min (right column) after start of flow with A: control medium, B: XZ.700 12.5 µg ml−1, C: XZ.700 25 µg ml−1, D: XZ.700 50 µg ml−1, E: PVP-I 0.35%, F: gentamicin 1000 µg ml−1. Green fluorescent protein (GFP) fluorescence is shown in green, propidium iodine (PI) fluorescence (indicative for cell death) is shown in red. The size bar represents 200 µm.
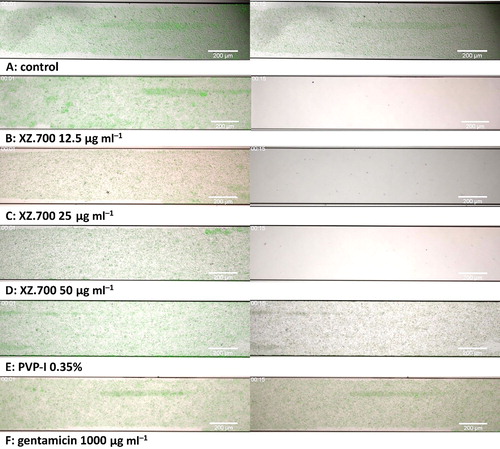
Figure 6. Proliferation of osteocyte-like cells (as amount of DNA), after 48 h exposure to 50% a-MEM and 50% MRSA biofilm supernatant, and a control (white bar; 100% a-MEM). The supernatants used were PBS + BSA (control), XZ.700 (12.5, 25 and 50 µg ml−1), PVP-I (0.35%), and gentamicin (1000 µg ml−1) in three different groups: without biofilm exposure (light grey bars), supernatant obtained after treatment of 24 h-old MRSA biofilm (dark grey bars), and supernatant obtained after treatment of 48 h-old MRSA biofilm (black bars). *Significantly lower than PBS + BSA and XZ.700 at 12.5, 25 and 50 µg ml−1 within own group.
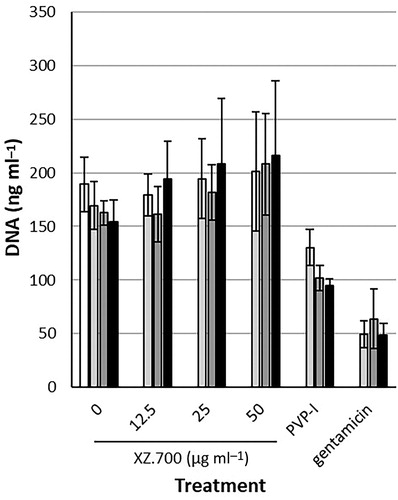
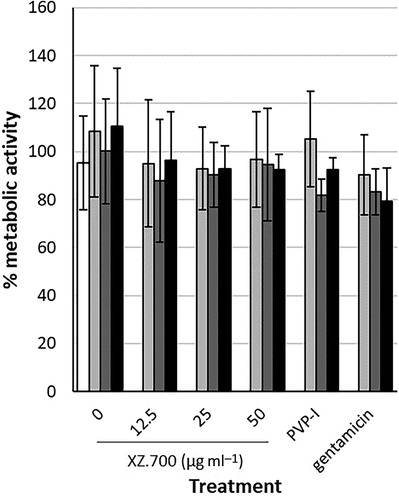
Figure 7. Metabolic activity of osteocyte-like cells, measured in percentage metabolized AlamarBlue, after 48 h exposure to 9% AlamarBlue, 45.5% a-MEM and 45.5% supernatant, and a control (white bar; 9% AlamarBlue, 91% a-MEM). The supernatants used were PBS + BSA (control), XZ.700 (12.5, 25 and 50 µg ml−1), PVP-I (0.35%), and gentamicin (1000 µg ml−1) in three different groups: without biofilm exposure (light grey bars), supernatant obtained after treatment of 24 h-old MRSA biofilm (dark grey bars), and supernatant obtained after treatment of 48 h-old MRSA biofilm (black bars).