Figures & data
Figure 1. In vitro autofluorescence measurements of 9-day Cylindrotheca closterium biofilms, as recorded with (A) light (top) and fluorescence microscopy (bottom) images (scale bars = 20 μm), and (B) merged fluorescence microscopy and plate reader fluorescence records, where bars represent standard error.
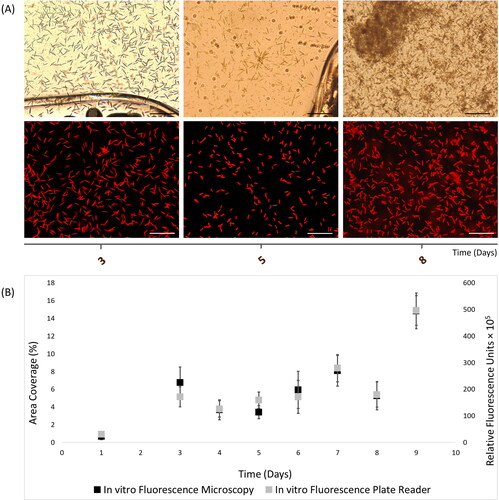
Figure 2. In vitro autofluorescence measurements of 9-day Nitzschia thermaloides biofilms, as recorded with (A) light (top) and fluorescence (bottom) microscopy images (scale bars = 20 μm), and (B) merged fluorescence microscopy and plate reader fluorescence records, where error bars represent standard error.
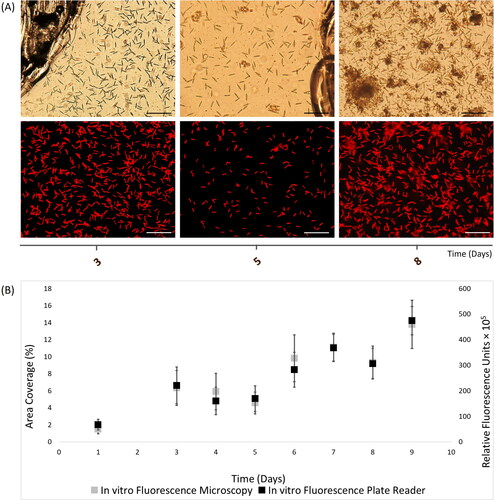
Figure 3. In situ autofluorescence measurements of 19-day natural phototrophic biofilms in Southsea Marina UK during Spring 2017, as recorded with (A) light (top) and fluorescence microscopy (bottom) images (scale bars = 20 μm), and (B) merged fluorescence microscopy and plate reader fluorescence records, where error bars represent standard error.
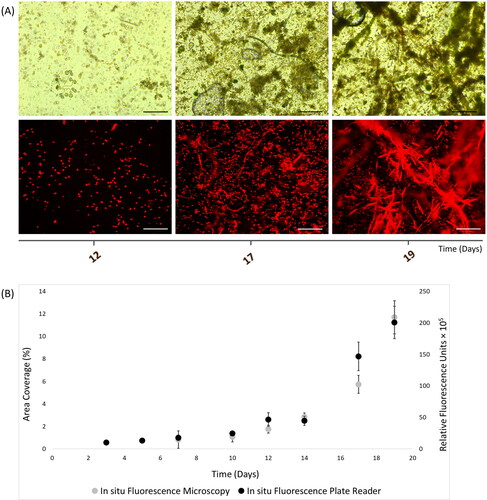
Figure 4. In situ autofluorescence measurements of 28-day natural phototrophic biofilms in Southsea Marina UK during Summer 2017, as recorded with (A) light (top) and fluorescence microscopy (bottom) images (scale bars = 20 μm), and (B) merged fluorescence microscopy and plate reader fluorescence records, where error bars represent standard error.
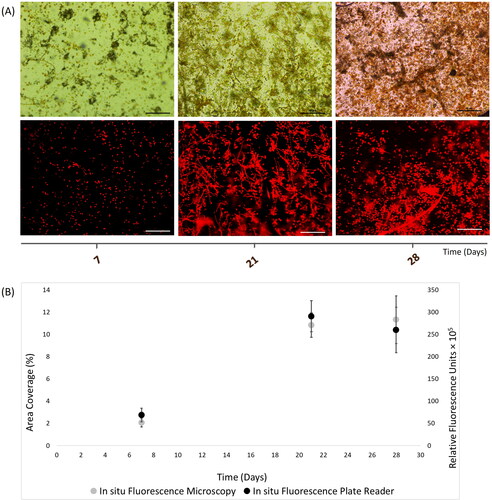
Figure 5. In situ autofluorescence measurements of 30-day natural phototrophic biofilms in Southsea Marina UK during Autumn 2017, as recorded with (A) light (top) and fluorescence microscopy (bottom) images (scale bars = 20 μm), and (B) merged fluorescence microscopy and plate reader fluorescence records, where error bars represent standard error.
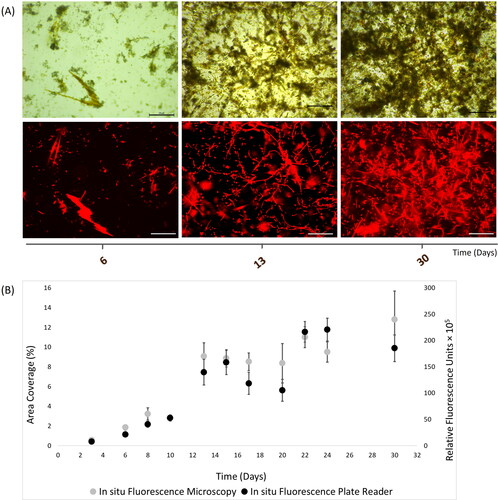
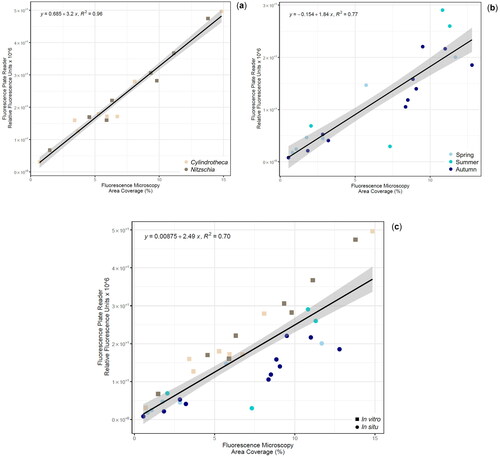
Figure 6. Scatterplot of general linear model for fluorescence measurements between plate reader and microscopy, testing (a) in vitro monoculture biofilms (R2 = 0.96), (b) in situ marine phototrophic biofilms (R2 = 0.77), and (c) both in vitro and in situ biofilms (R2 = 0.70).